PROBLEM STATEMENT
PROBLEM STATEMENT
Understanding and changing the visitor's perception of sharks; for a new exhibit at the Georgia Aquarium.
Understanding and changing the visitor's perception of sharks; for a new exhibit at the Georgia Aquarium.
RESEARCH, DESIGN AND EVALUATION | 2019 | COURSE PROJECT
RESEARCH, DESIGN AND EVALUATION | 2019
Georgia Aquarium
Georgia Aquarium
ABOUT THE COMPANY
Being the largest aquarium in the western hemisphere, The Georgia Aquarium boasts more than 100,000 animals; representing several thousand species. The Aquarium houses this massive variety of marine fauna in 10 million gallons of marine and saltwater.
As a part of their Expansion 2020 plan, they plan on opening a new shark-themed exhibit that would contain several species of sharks within a large tank that would allow guests to view these predators up-close.
DURATION
August 2019 - December 2019
TYPE OF ENGAGEMENT
A project for the graduate-level course PSYC 6023: Research Methods for HCI in collaboration with the Georgia Aquarium.
MY ROLE
Within a team of five, assisted with conducting user research and the eventual evaluation of the designs. Took lead on developing the mobile prototype of the proposed design.
WHAT'S
The Requirements
The Requirements
The Georgia Aquarium believes that sharks should be viewed as more than simply being 'maneaters'. Through their upcoming Expansion 2020 shark-themed exhibit, they would like their visitors to look at sharks from a new perspective.
STAKEHOLDER SAYS:
“...change the conversation around sharks to change from fear to fascination."
“...change the conversation around sharks to change from fear to fascination."

While the exhibit is currently being designed to support this narrative, they wanted us to explore technological interventions within the exhibit to support the change of perception.
Additional goals for the project were defined as:
[1]
To break stereotypes, educate, and inform the audience about the shark’s role in the marine ecosystem.
To break stereotypes, educate, and inform the audience about the shark’s role in the marine ecosystem.
[2]
To provide an added element of entertainment to the exhibit through the design.
[3]
To increase awareness about the Aquarium's biological and conservation efforts towards sharks.
WHAT'S
The Timeline
The Timeline
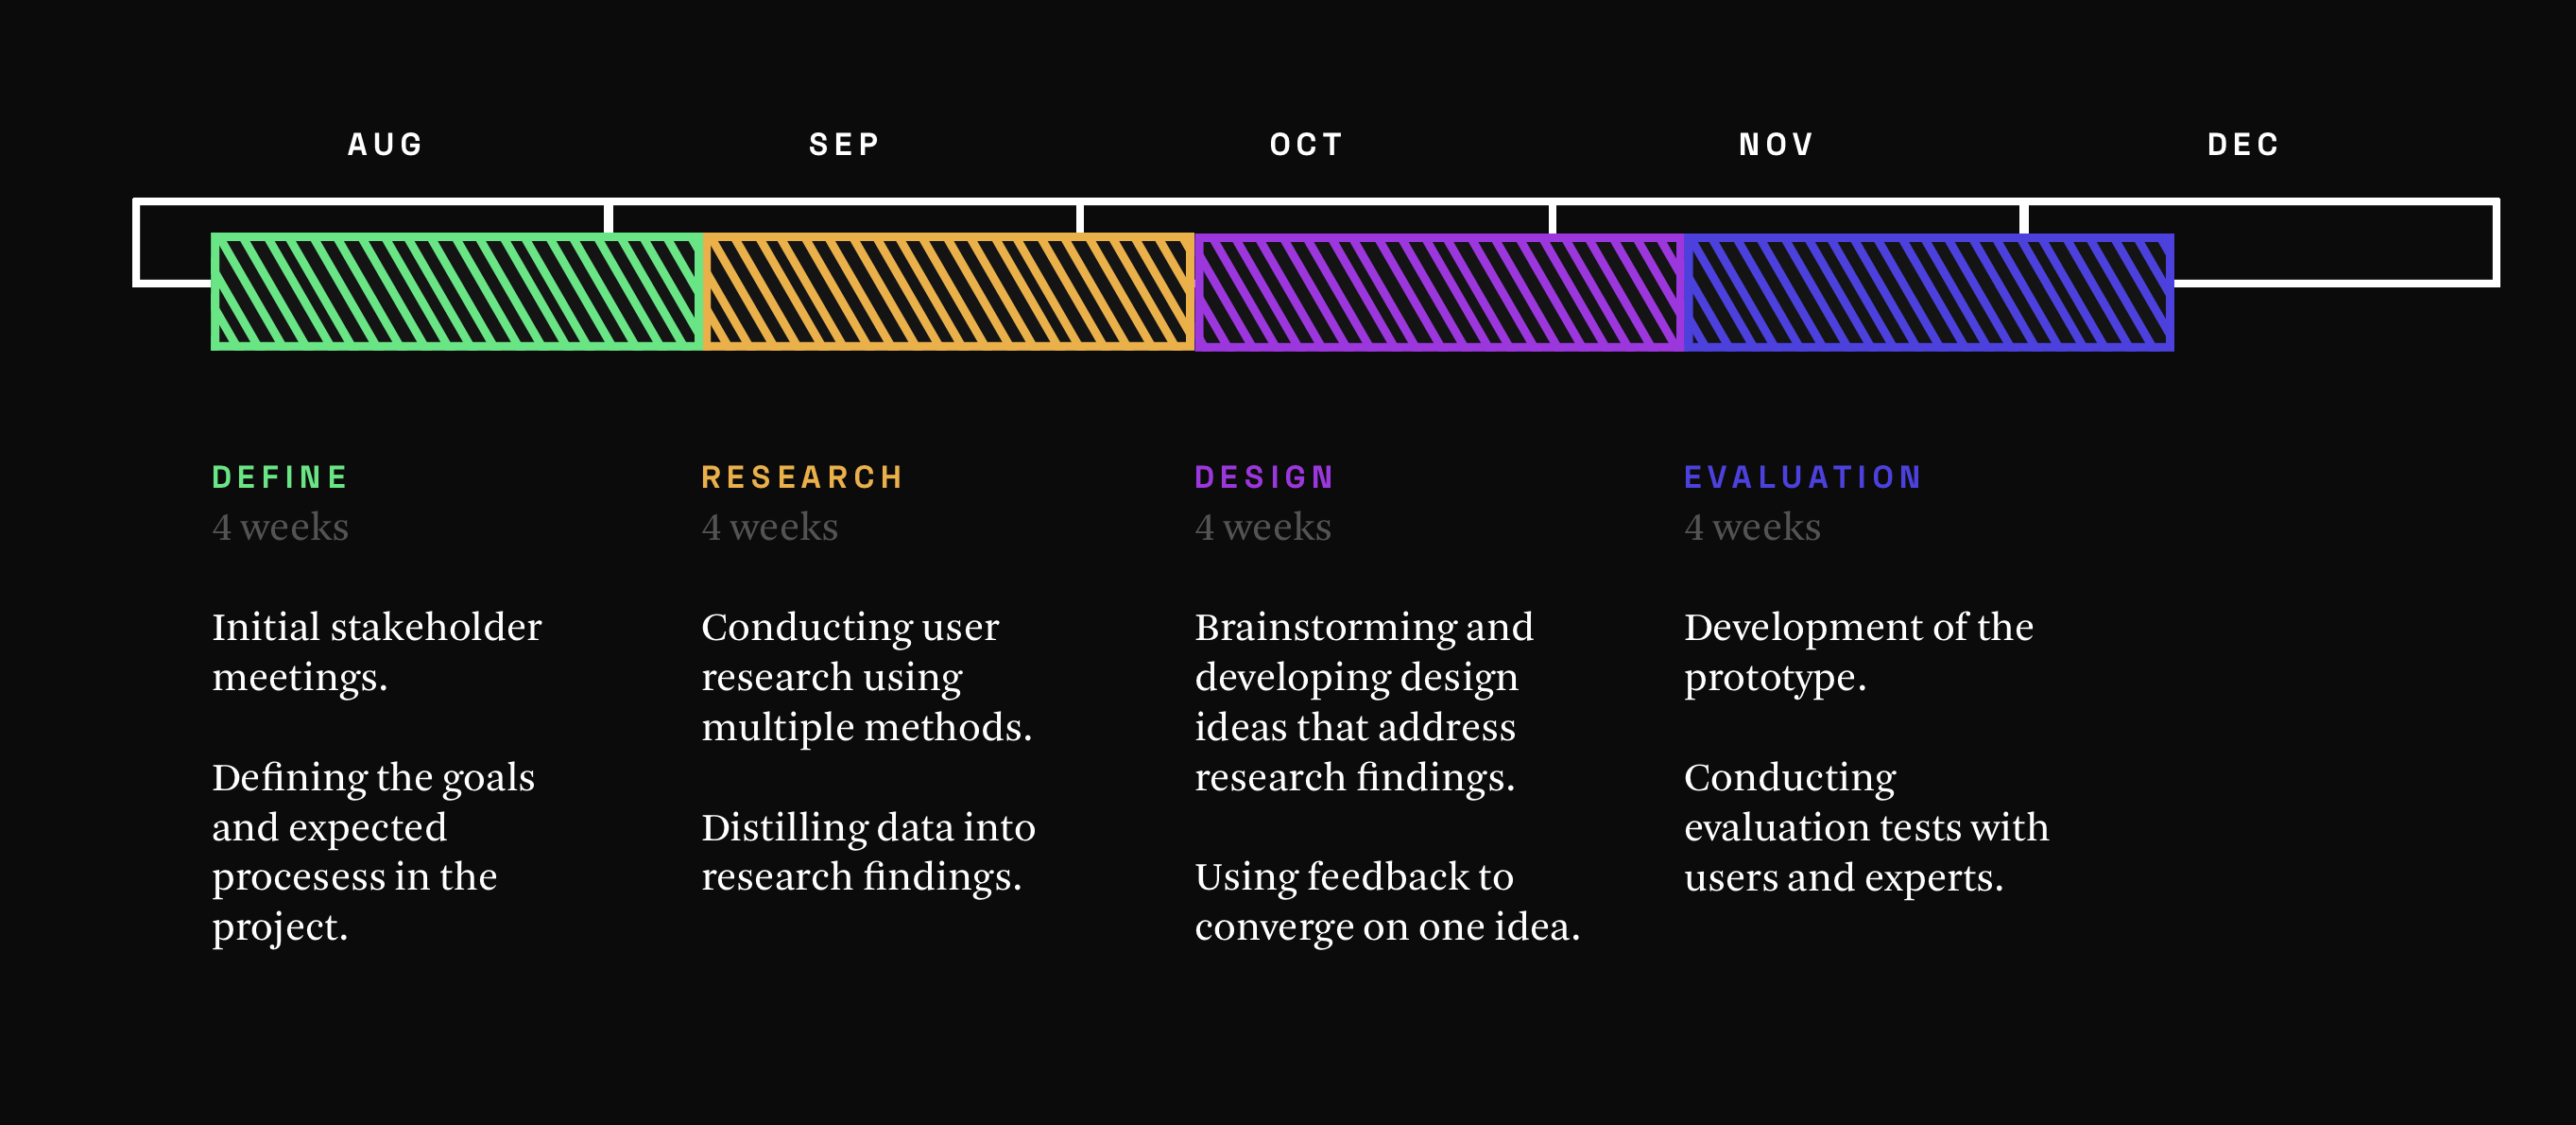
Over the course of the Fall 2019 semester, the team had to define a timeline for the project. Since this project was for a research methods course, we decided to focus on having research-driven design decisions while brainstorming design ideas. Furthermore, we also focused on evaluating our proposed design solutions through subject matter experts (SMEs) and representative users.
UNDERTAKING
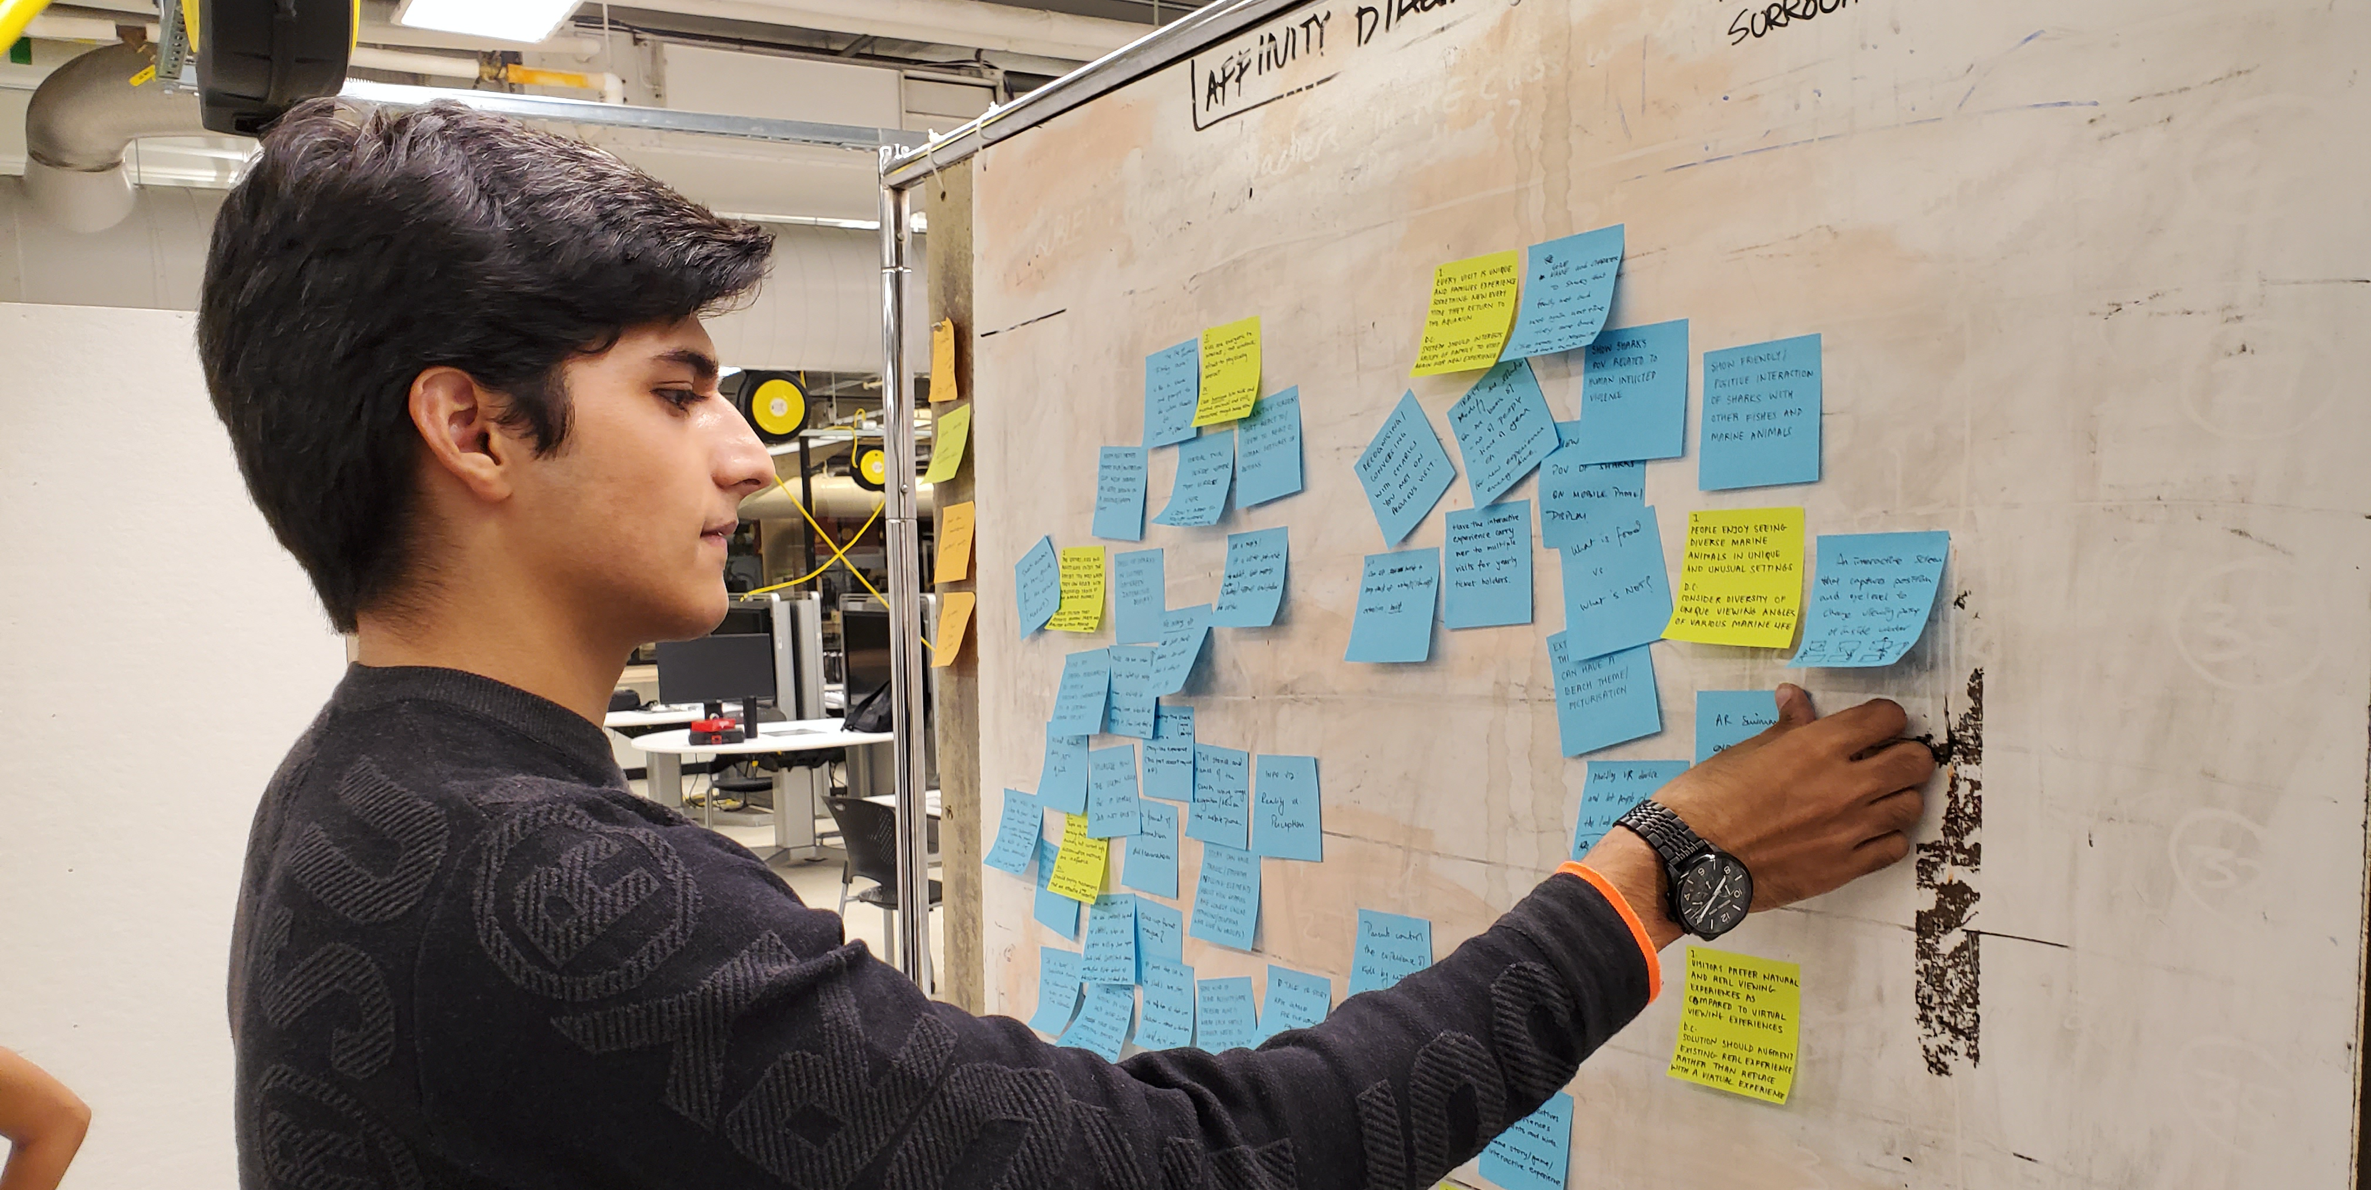
The User Research
The User Research
In order to understand the design space better, we decided on a two-pronged approach to the problem.
First, we would understand on problems faced by visitors in the aquarium. These problem areas would offer design opportunities for technological interventions.
Second, we wanted to learn more about what are the existing, preconceived notions of sharks among visitors. This information would help us decide which message should our design solution focus on conveying.
We used the following research methods to address these two research requirements:
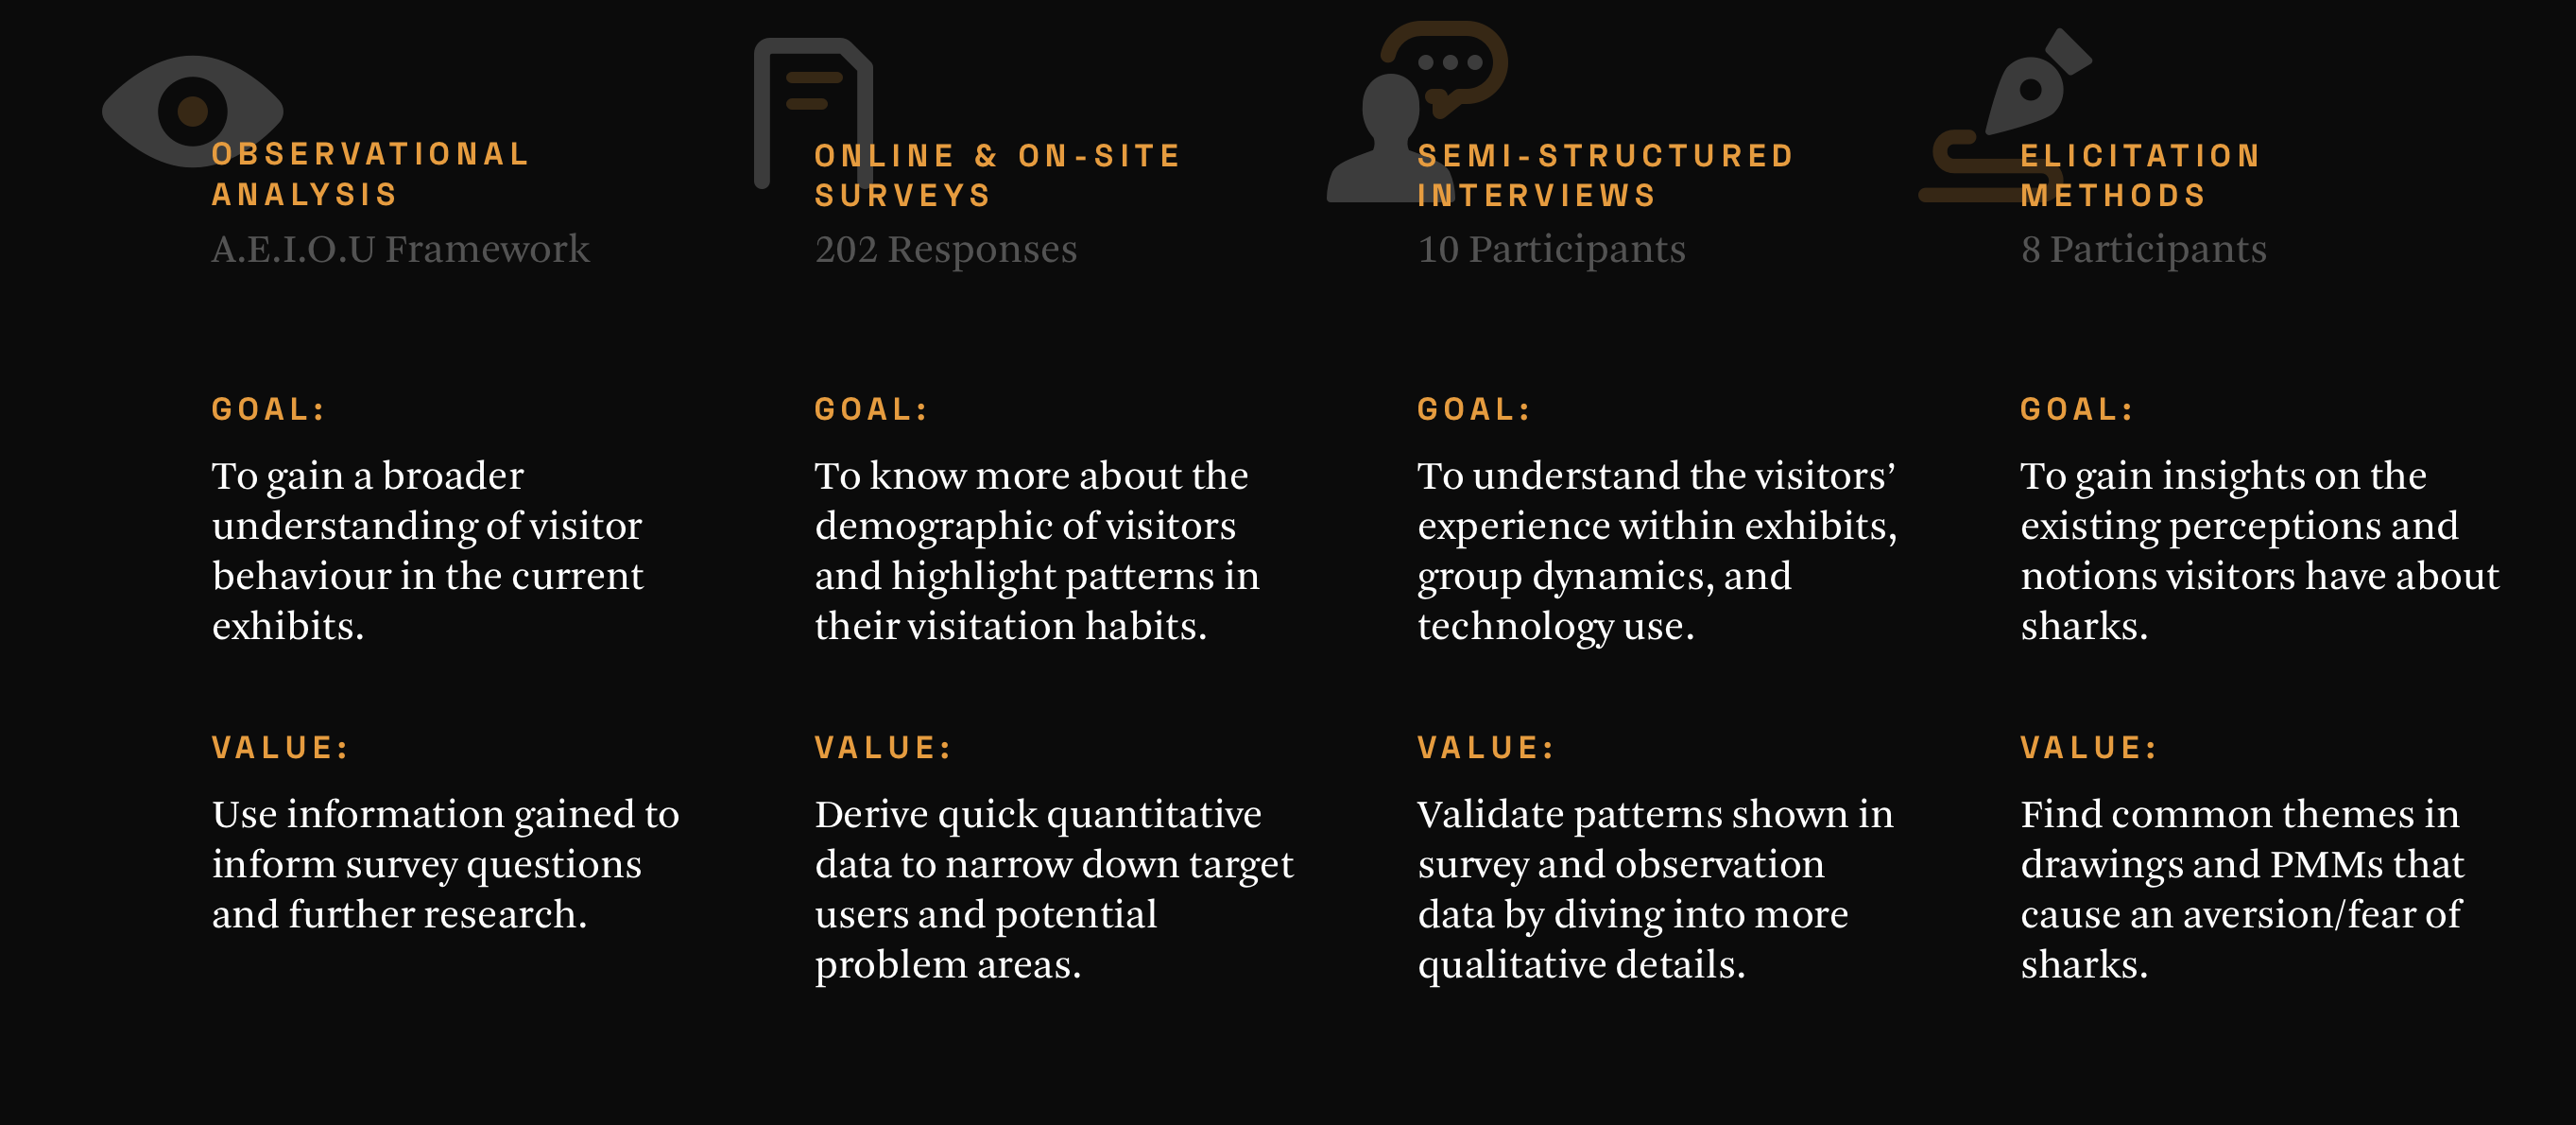

The data obtained from each research method was documented and analyzed by the team. We prepared several reports that were discussed with stakeholders. These meetings allowed us to highlight notable findings from the research and discuss the next steps.
Having regular meetings with the PMs and the developers to iterate over ideas was crucial. This collaboration provided a healthy balance between creativity, feasibility and business requirements.

DISTILLING
The Research Findings
The Research Findings
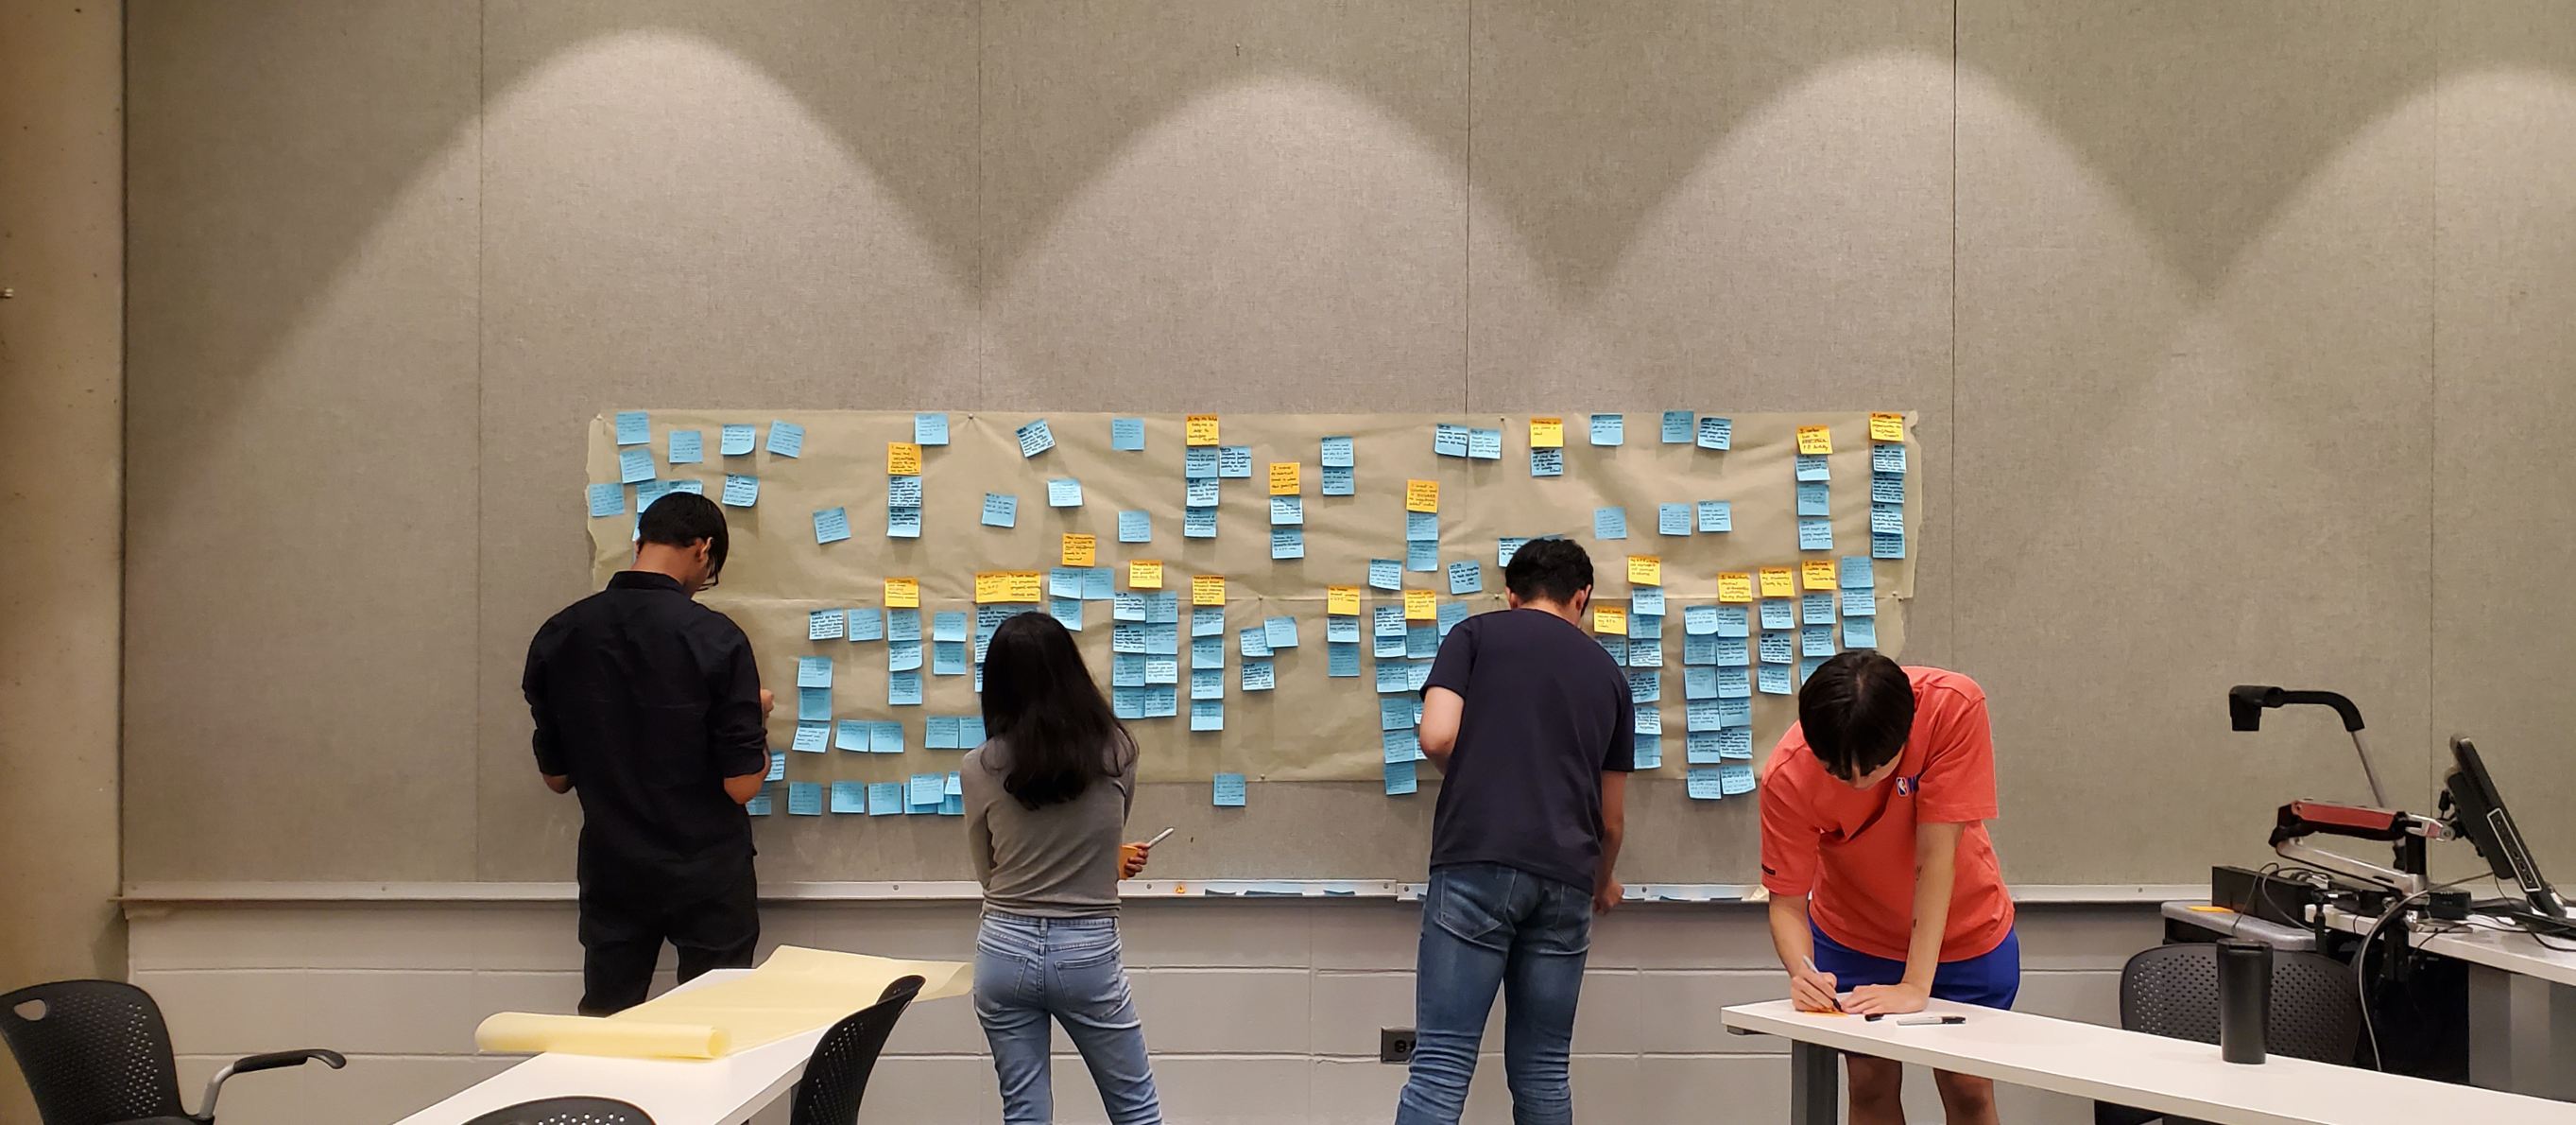
After analyzing the data from our research, we were able to define 13 notable findings and what implications these findings might have on our project. Out of these, we decided to focus on the following 6 findings as potential problem areas or user needs to design for.
FINDING #1
The visitors, kids and adults alike, enjoy the exhibit the most when they can relate with personified traits of the marine animals.
The visitors, kids and adults alike, enjoy the exhibit the most when they can relate with personified traits of the marine animals.
FINDING #2
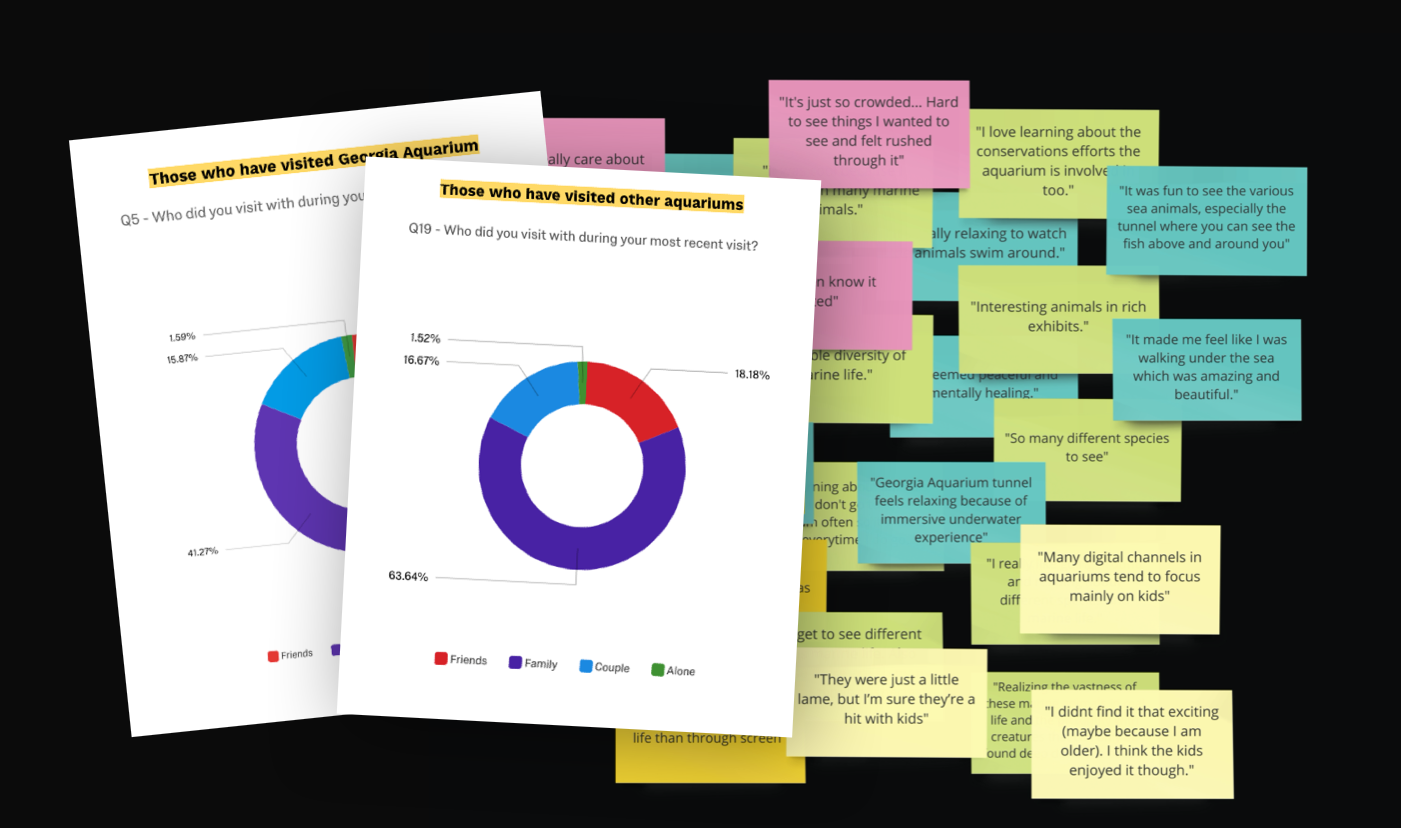
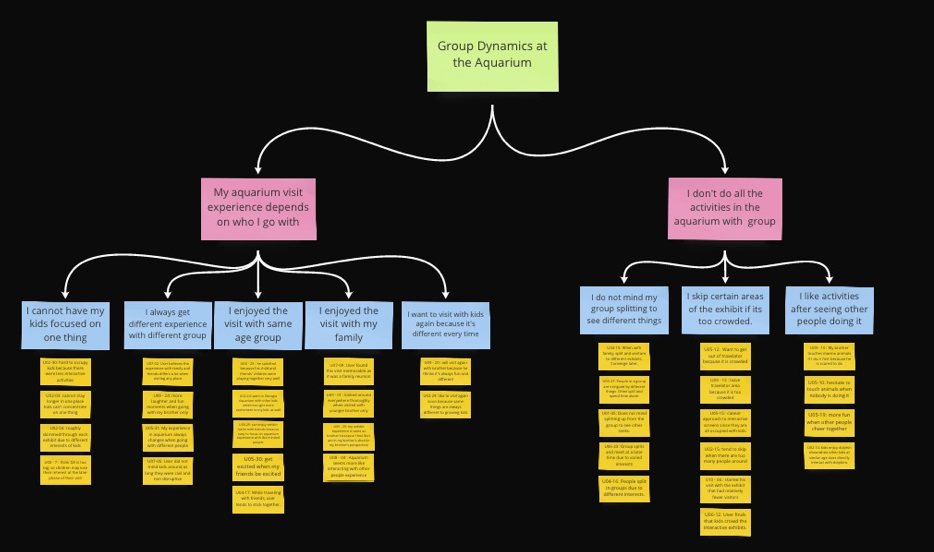
Most visitors to the aquarium travel to the aquarium in a group, mostly families.
FINDING #3
Parents feel like they have to compromise their experience at the aquarium in order to give their kids a better experience.
FINDING #4
Every visit is unique, and families experience something new every tie they return to the aquarium.

FINDING #5
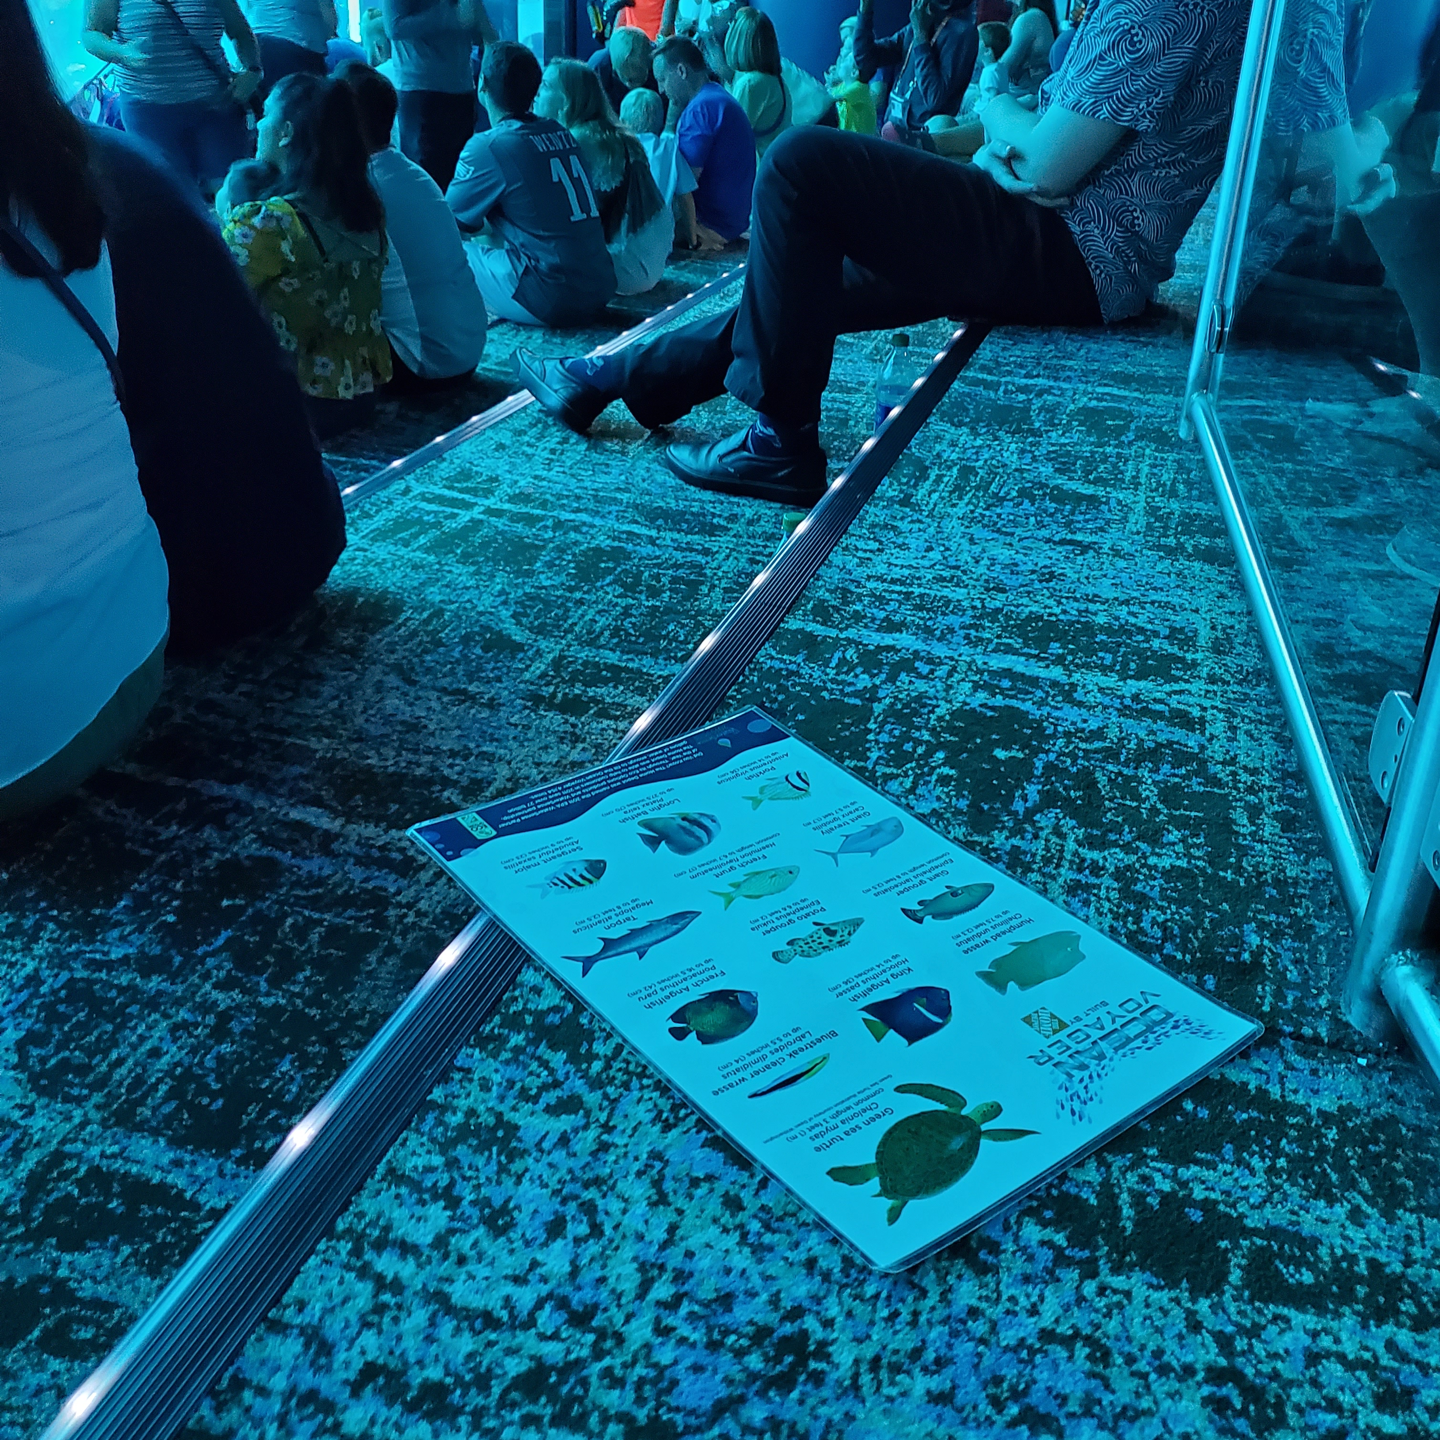
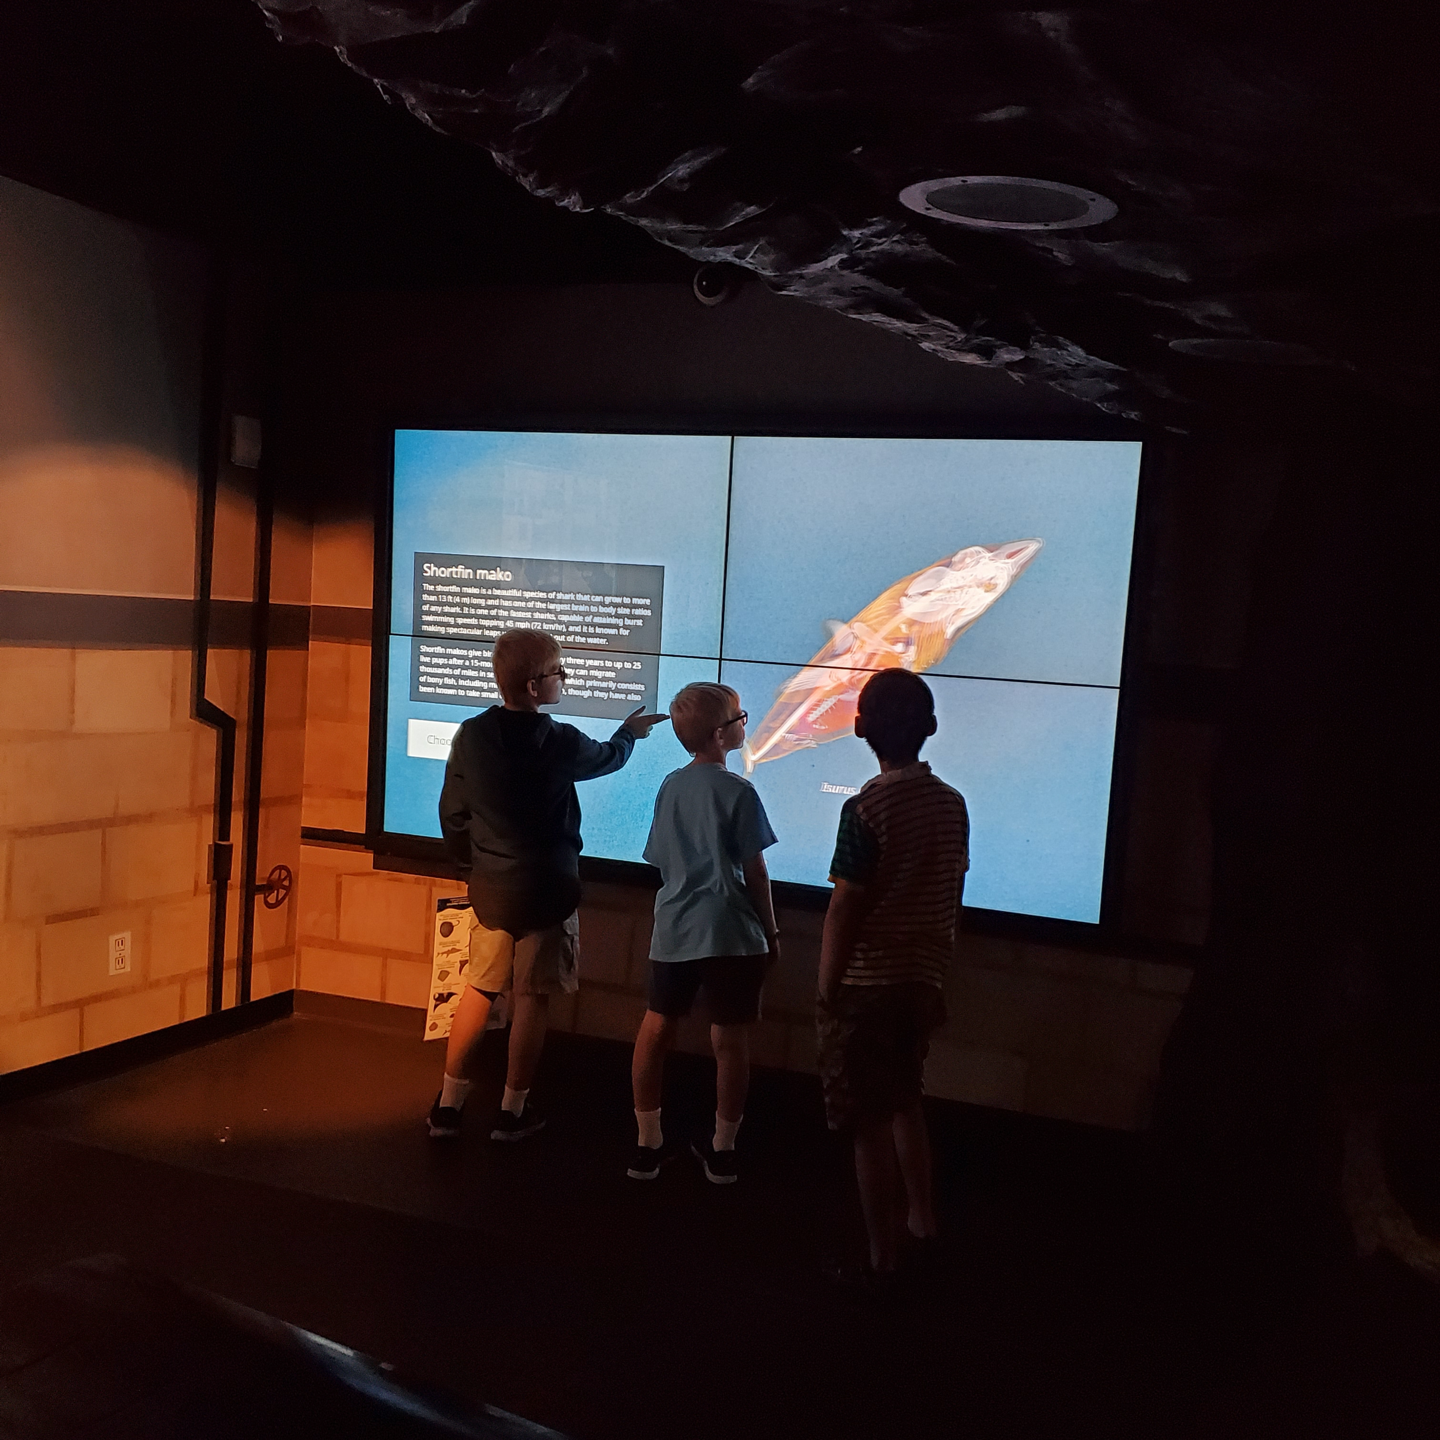
People are interested in learning facts about marine animals. However, the current information dissemination mechanisms are not effective.
People are interested in learning facts about marine animals. However, the current information dissemination mechanisms are not effective.
FINDING #8
People enjoy seeing diverse marine animals in unique and unusual settings.
People enjoy seeing diverse marine animals in unique and unusual settings.
FINDING #6
Kids are very energetic and willing to interact with marine animals through viewing windows. But, they are apprehensive and afraid when they have to physically interact with them.
FINDING #7
Visitors prefer natural and real viewing experiences as compared to virtual viewing experiences.
BRAINSTORMING AND VALIDATING
The Design Ideas
The Design Ideas

Research-driven design ideation. That's the strategy we used while brainstorming ideas. This was used to ensure that our creativity directly is invested in addressing the key research findings.
We generated a number of design ideas that tackle problems or needs highlighted through our findings. From this bunch, we combined similar ideas - in terms of fundamental design and findings addressed - and ended up with four divergent ideas.
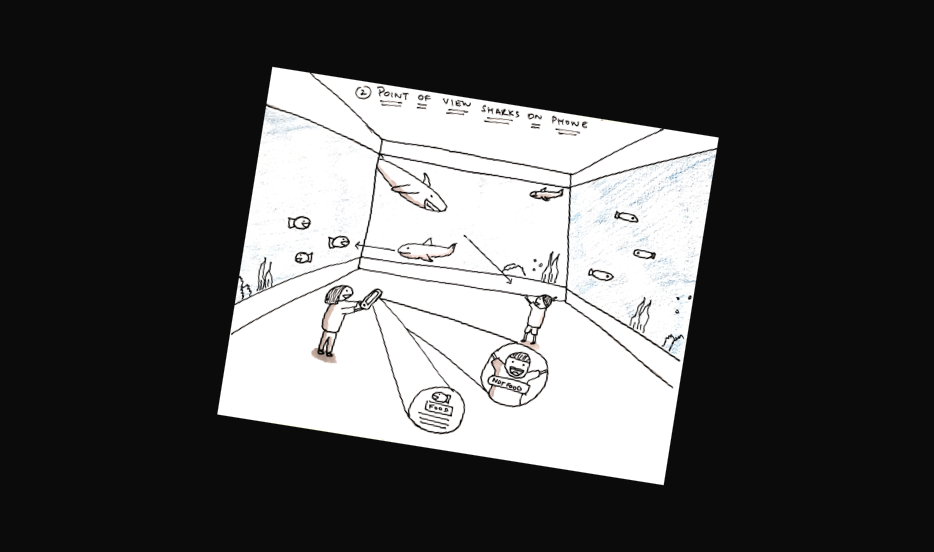
DESIGN IDEA #1
Visitors can see themselves from a shark's perspective; has an added game telling visitors about what is food and what is not for the shark.
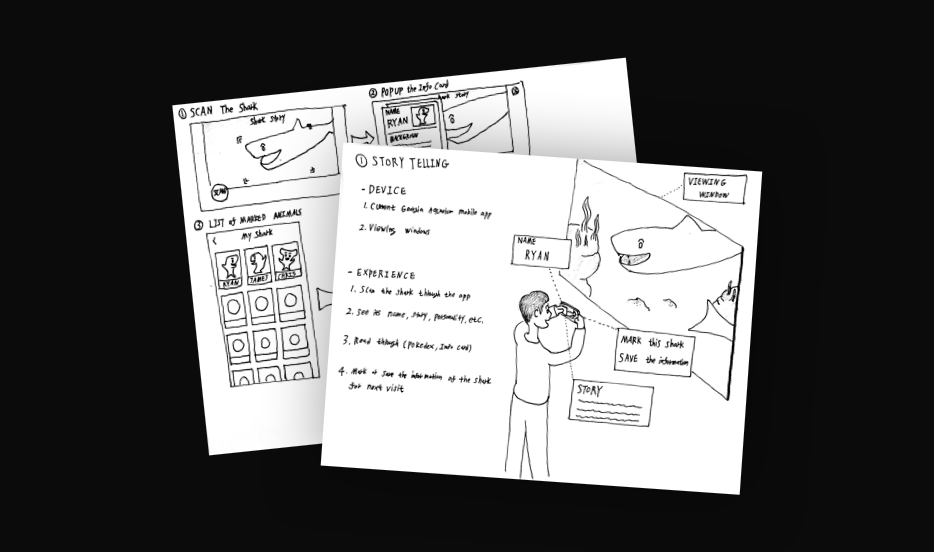
DESIGN IDEA #2
Visitors can scan sharks on a mobile application that proceeds to tell a story about the scanned shark; can 'collect' sharks over time (and multiple visits).
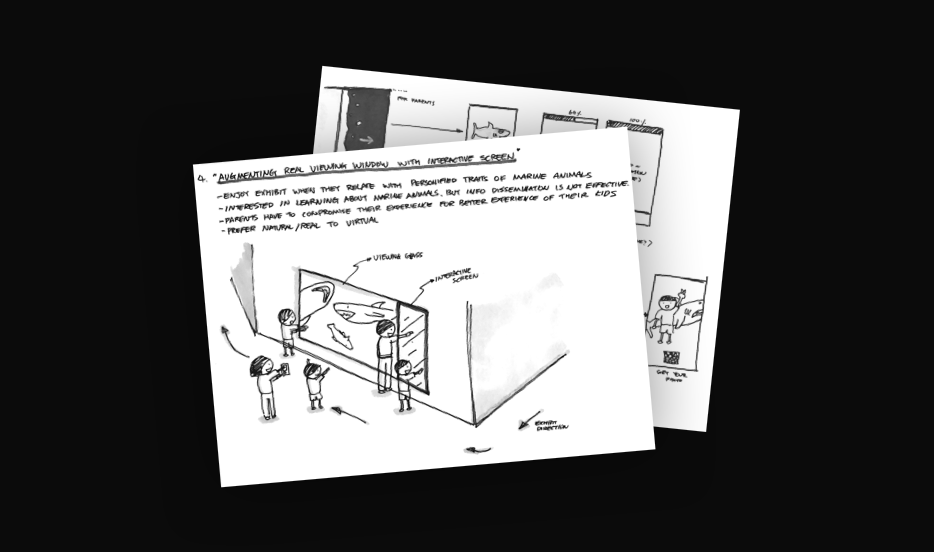
DESIGN IDEA #3
Augmenting the viewing experience by having an interactive display right next to the gallery window; tells information about the sharks inside.
DESIGN IDEA #4
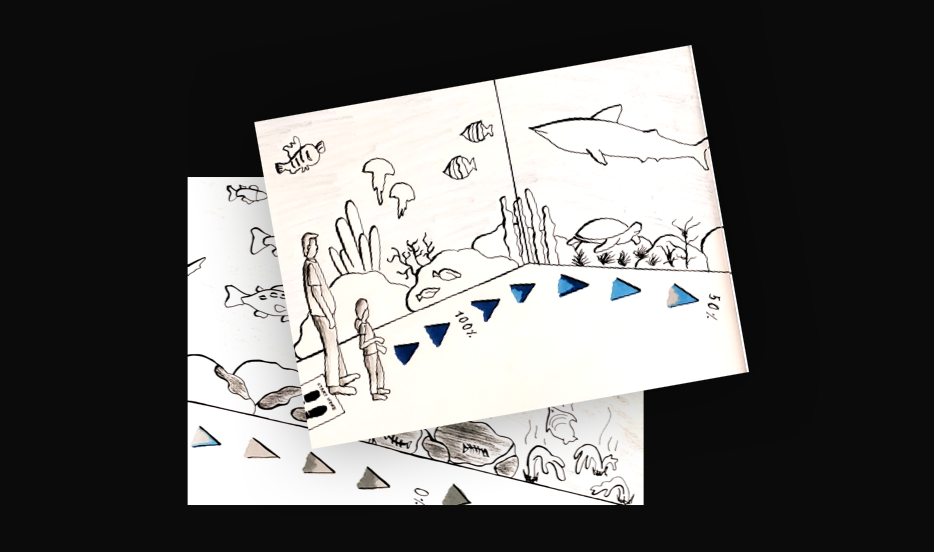
Visualizing the change in an ocean's ecosystem as a shark's population declines; the wall-sized display degrades ocean quality as users walk through it.
In order to choose the direction that we would pursue in our design, we took feedback from stakeholders and participants who had previously visited the Georgia Aquarium, preferably with friends and/or family.
For stakeholder feedback, our main goal was to find out which of the four design concepts were most desirable for the Georgia Aquarium. The presentation was followed by an informal discussion on the strength and weaknesses of every idea. We sought feedback from the stakeholders on topics such as integrability, feasibility, and practicality of the ideas.
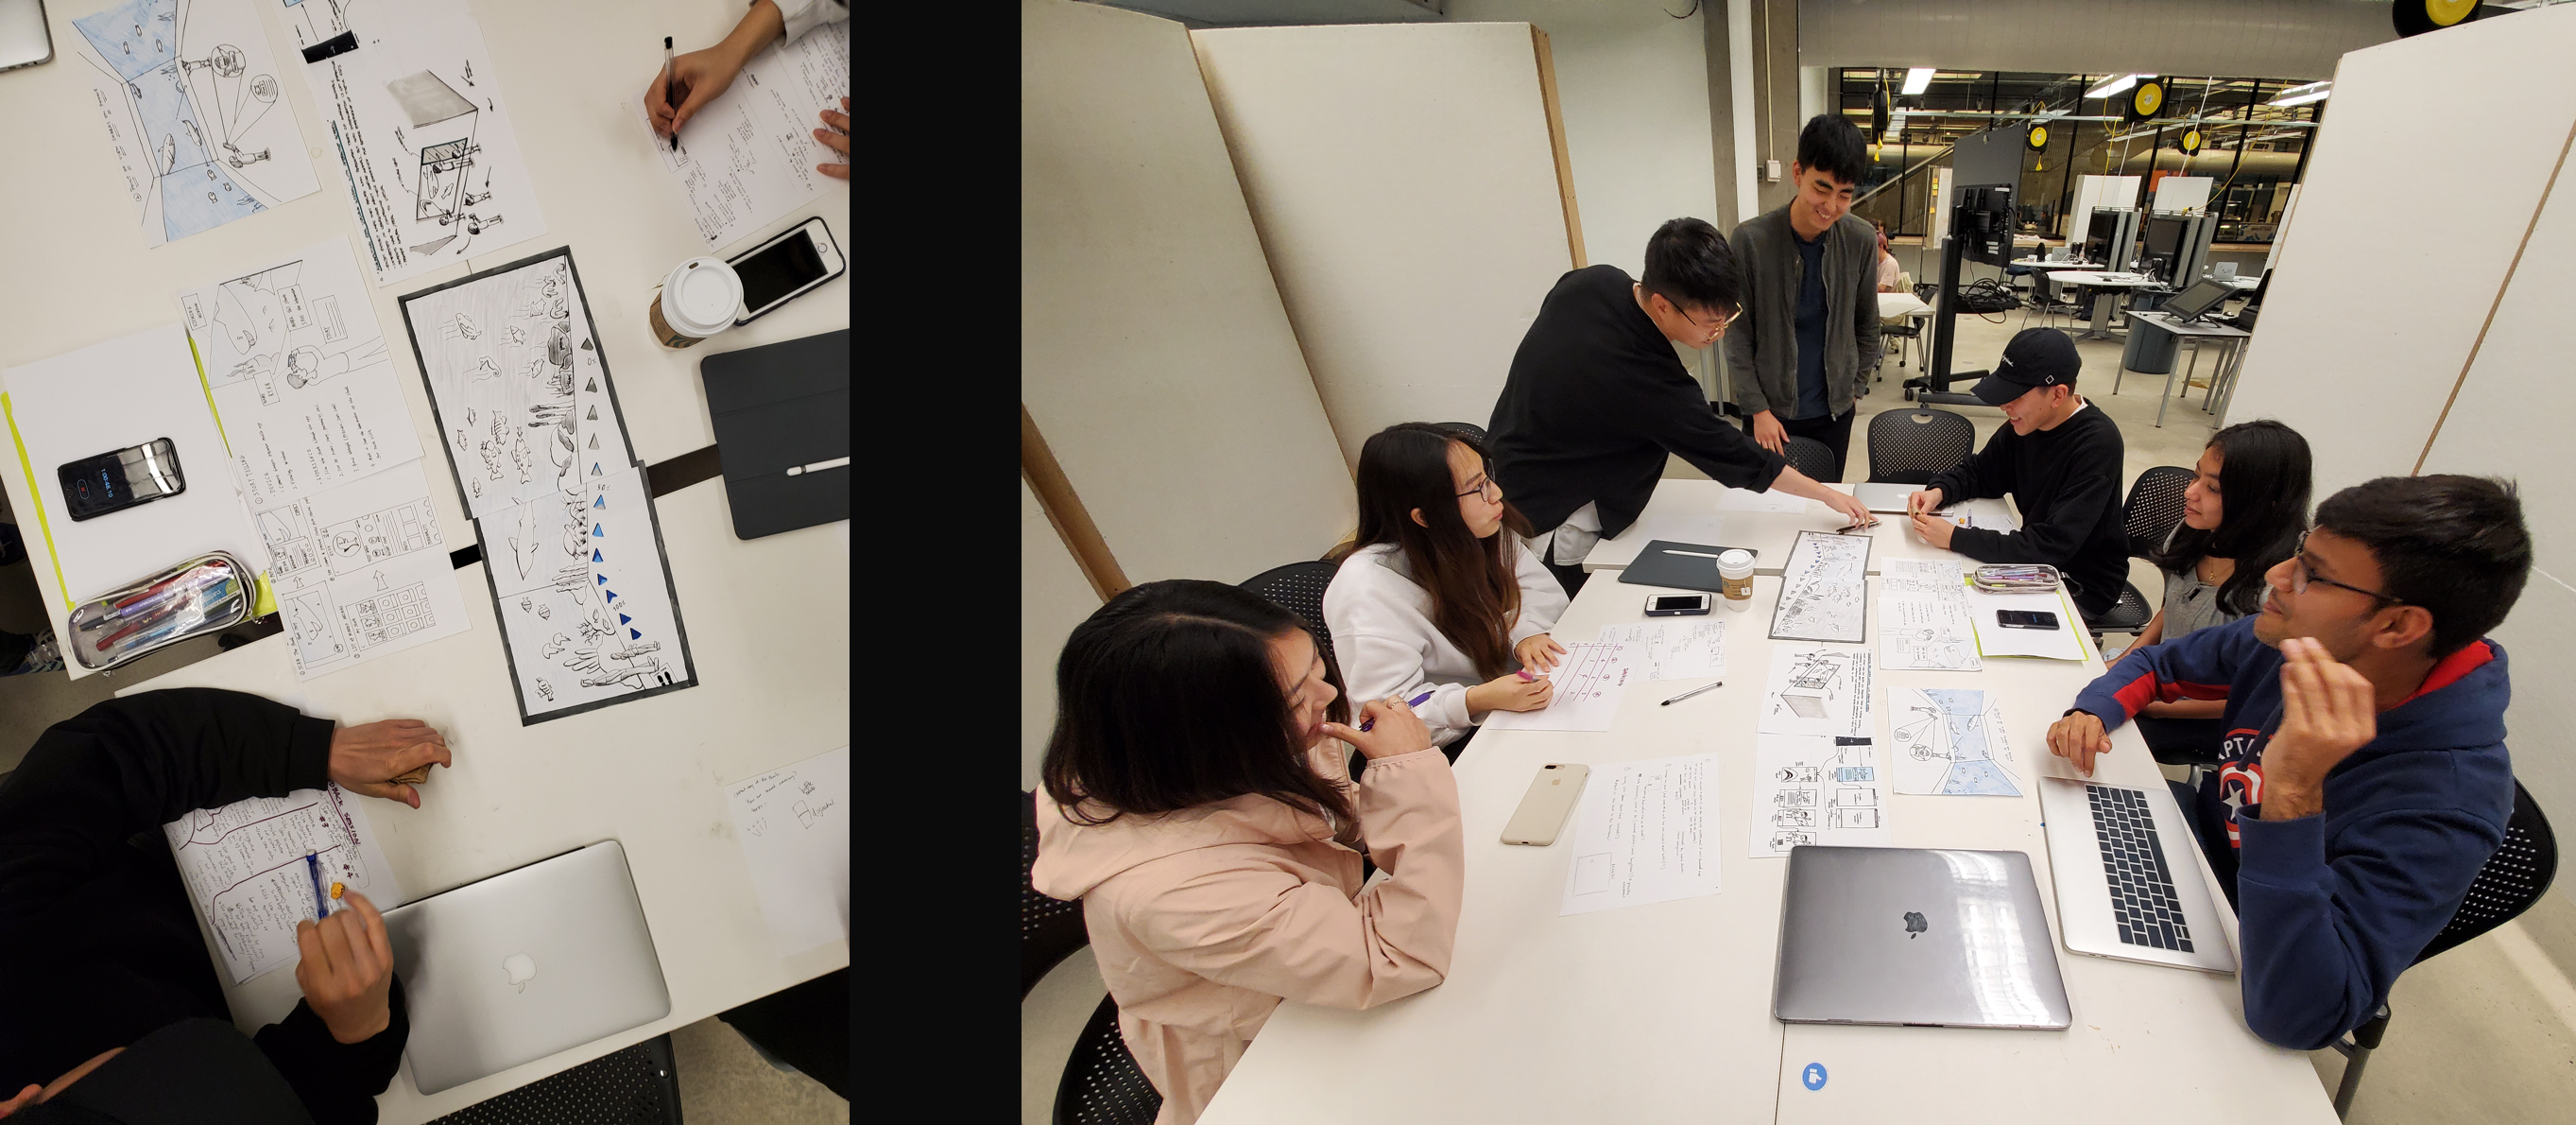

For the participant feedback session, we conducted a focus group where the four potential design solutions were presented, followed by a discussion. Our goal with the session was to gauge which of the four solutions is the most appealing to an average visitor to the Georgia Aquarium. The session was open-ended, however, we sought feedback on the desirability, utility, and usability of our concepts.
These are some the things we ended up learning from these sessions:

FINDING #1
Based on the feedback we received, it was clear that while each design idea had unique positive affordances, each of them also had several usability or technological shortcomings.

FINDING #2
There was no clear favorite among the four ideas for both stakeholders and study participants. However, there was a distinction between the individual success of the design ideas.
Merging features into a single design proposal.
Using these insights, we narrowed down to the idea of merging the affordances of multiple ideas into a single design project. Keeping the strongest aspect of each solution as highlighted in our research and initial testing, we tried to design a solution that addresses those needs coherently. The proposed design involves both adults and children by providing different kinds of information to the different age groups.
LOW-FIDELITY WIREFRAMES
A web-based mobile application that lets users scan sharks, name them, and read information about them.
PAPER PROTOTYPES
To mimic the experience of a large interactive display, we made large paper prototypes with movable sharks and dialog boxes.
We had participants interact with our low-fidelity prototype by pairing up as family and friends. They were asked to think aloud as they engage with the product. We hoped to see if the participants can clearly understand instructions and go through the entire flow of the product. Additionally, we wanted to validate that the prototype addressed research findings uncovered in our earlier findings.
After this session, the team felt confident about the design idea as validated by stakeholders from the aquarium and multiple participants from the feedback sessions we engaged in. We also had a list of design improvements for our idea from the sessions.

DEVELOPING
The Prototype
The Prototype

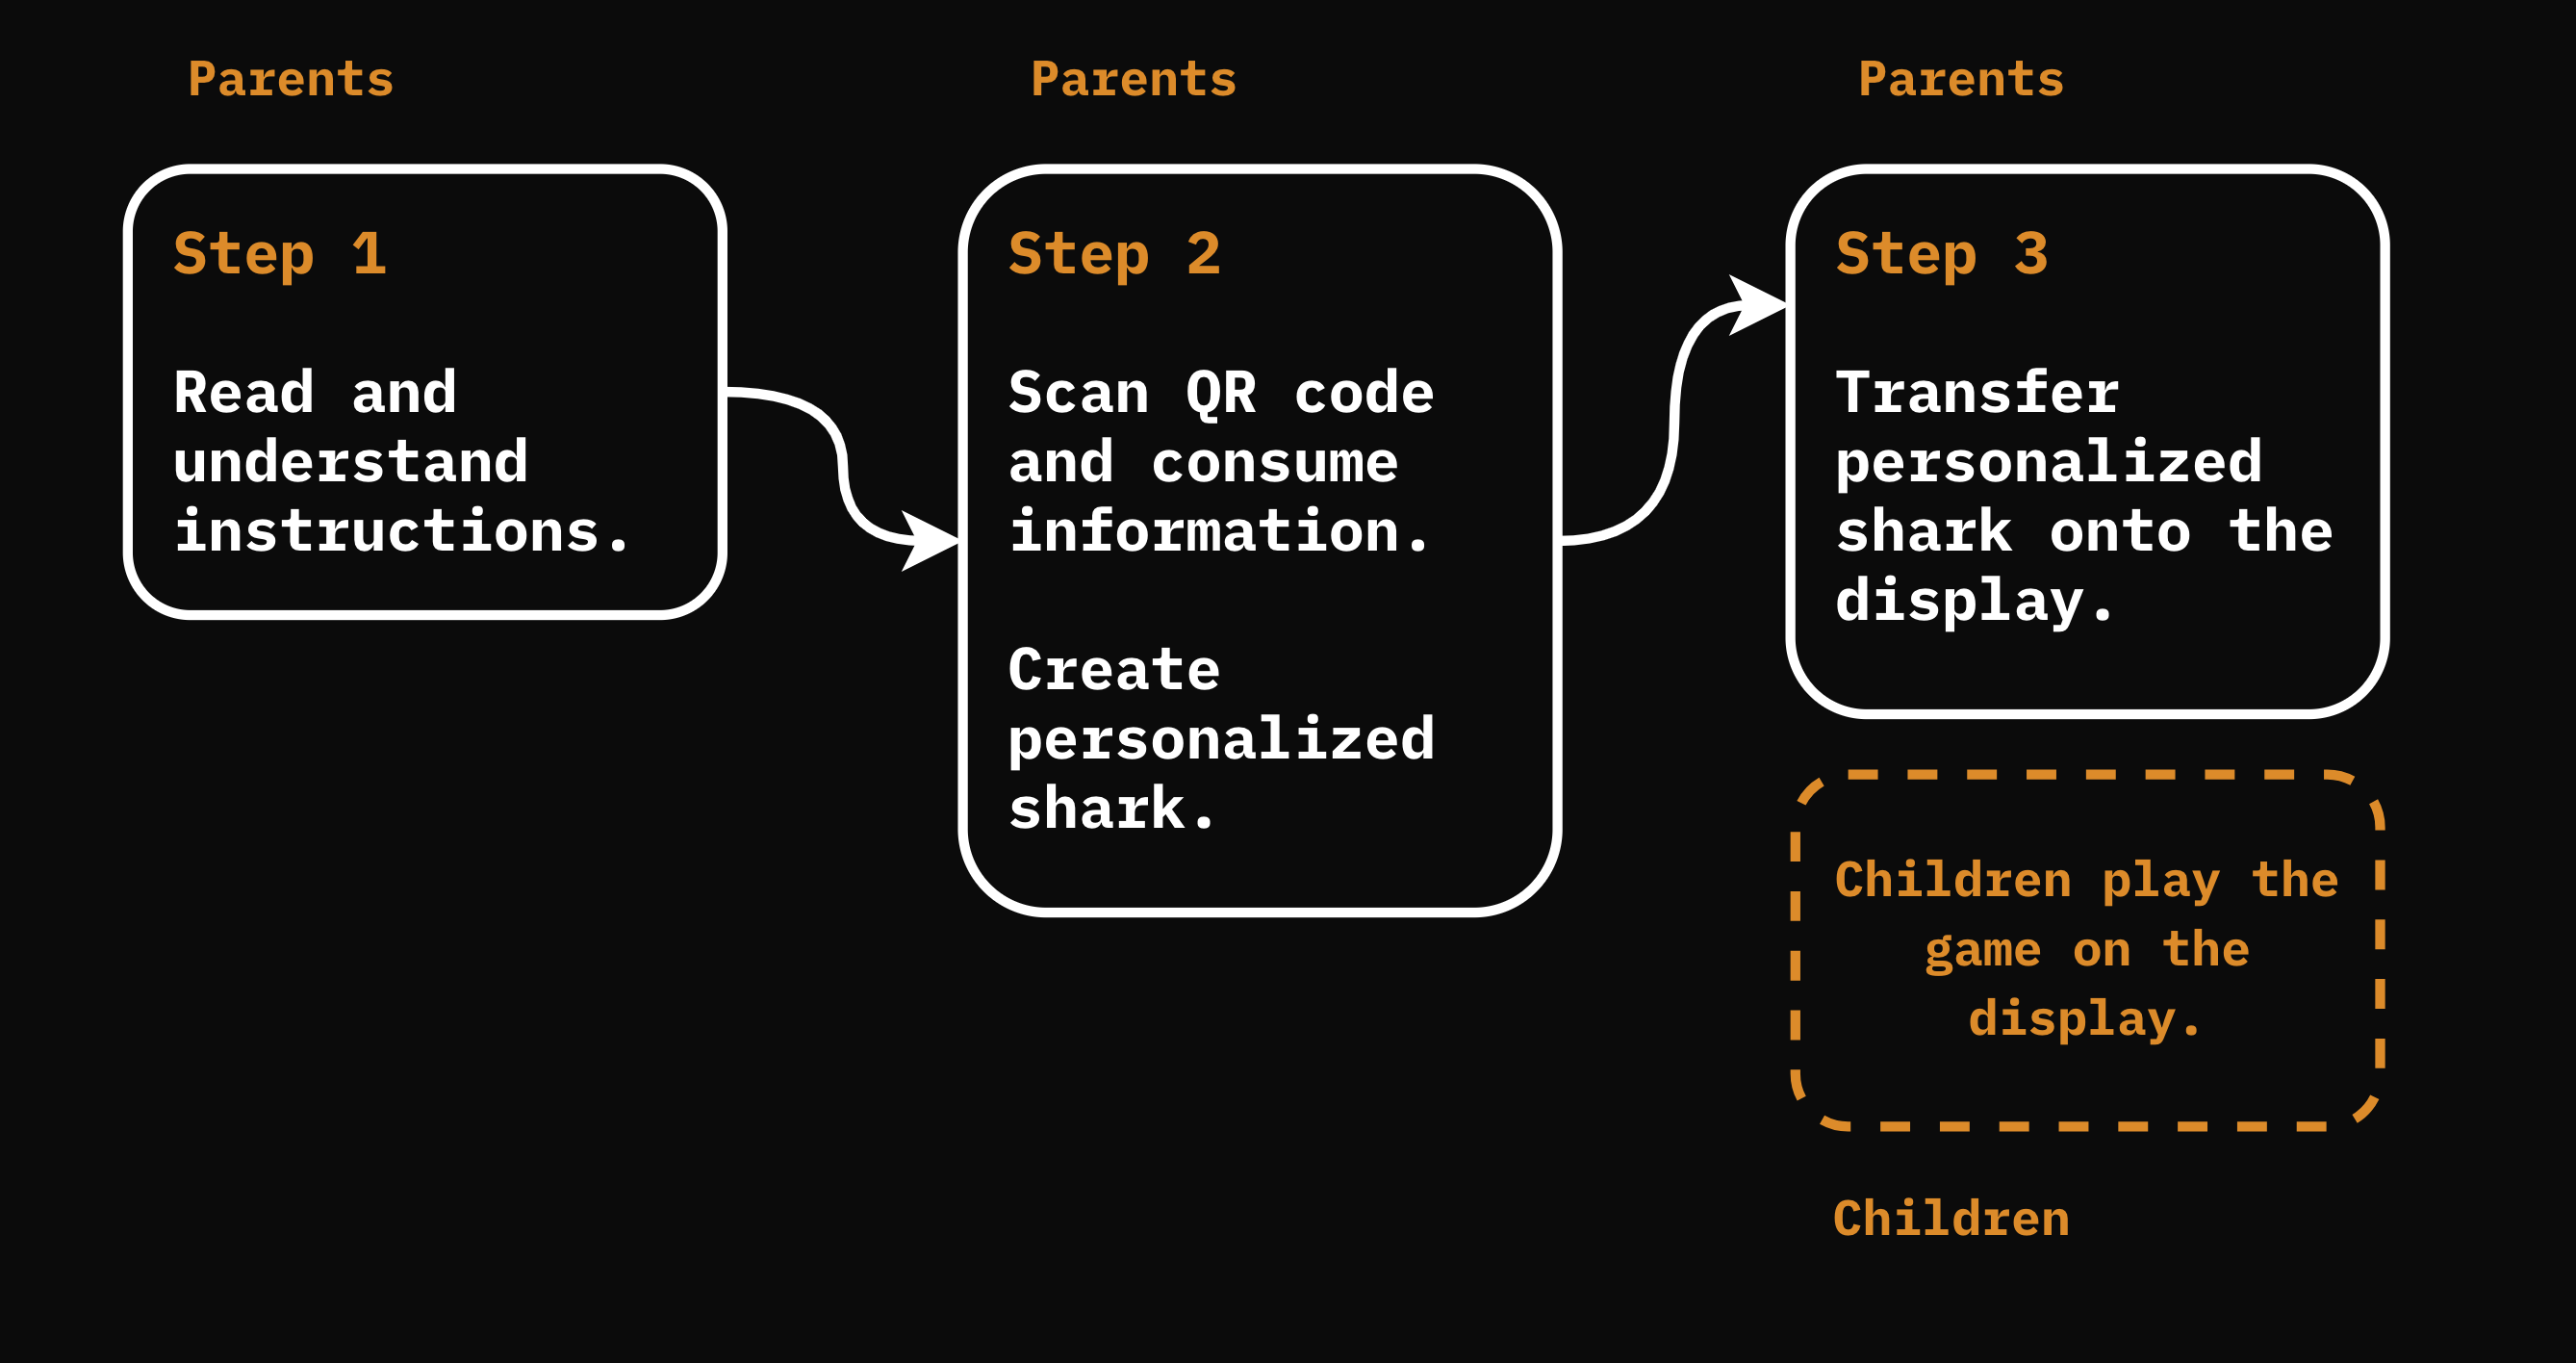
We developed high fidelity prototypes based on the learnings from our low-fi ones. Our design is a three-part system of multiple prototypes in sequence that users can interact with throughout the exhibit.
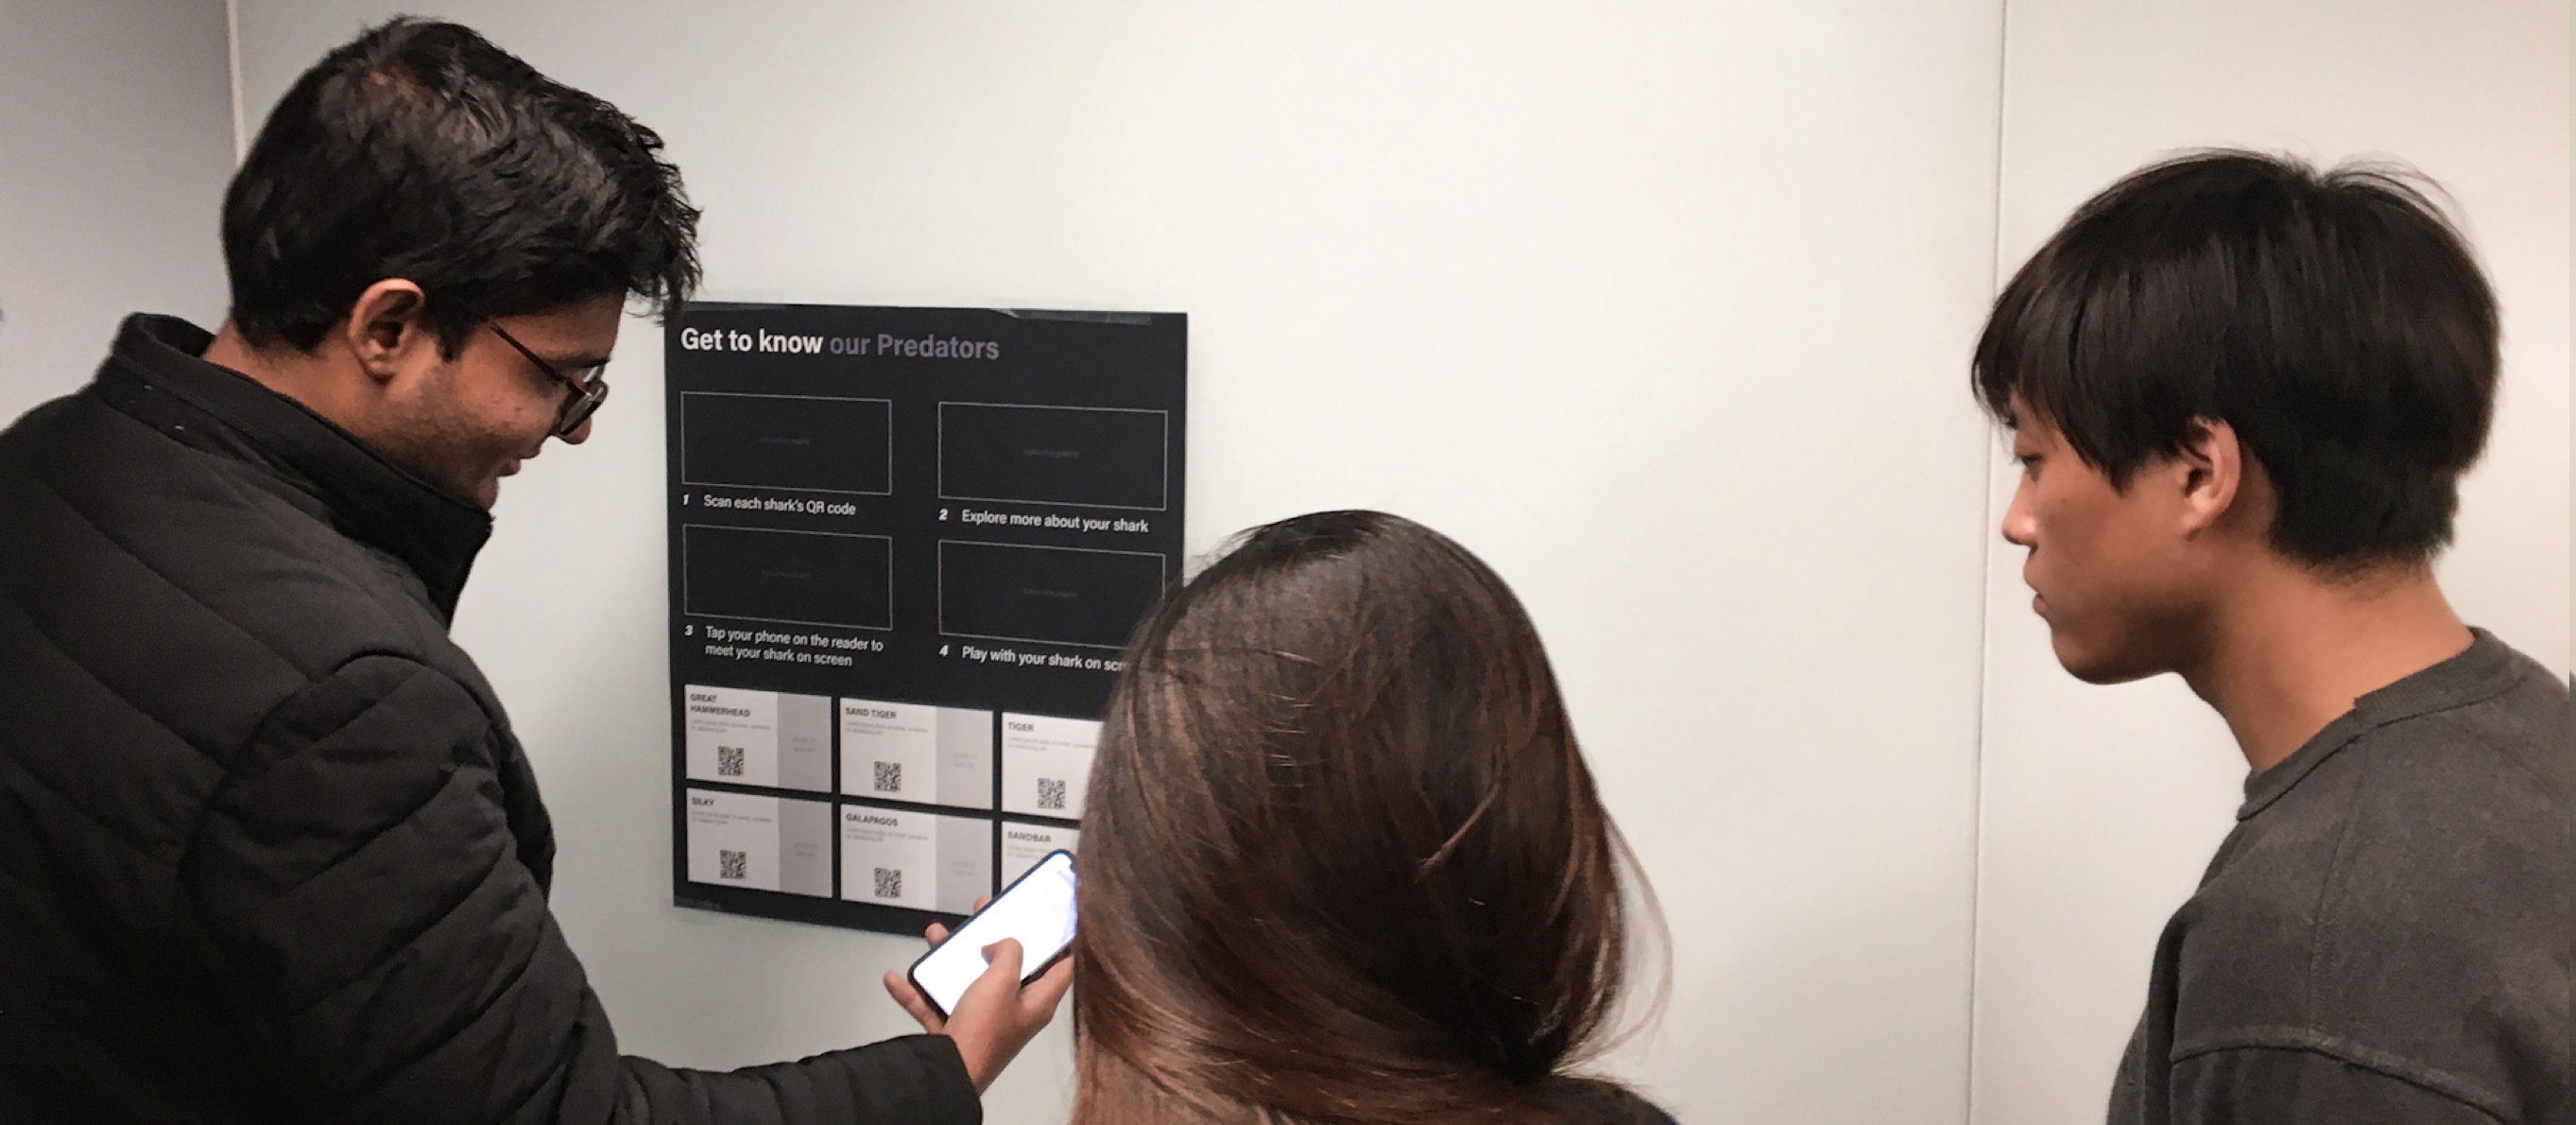
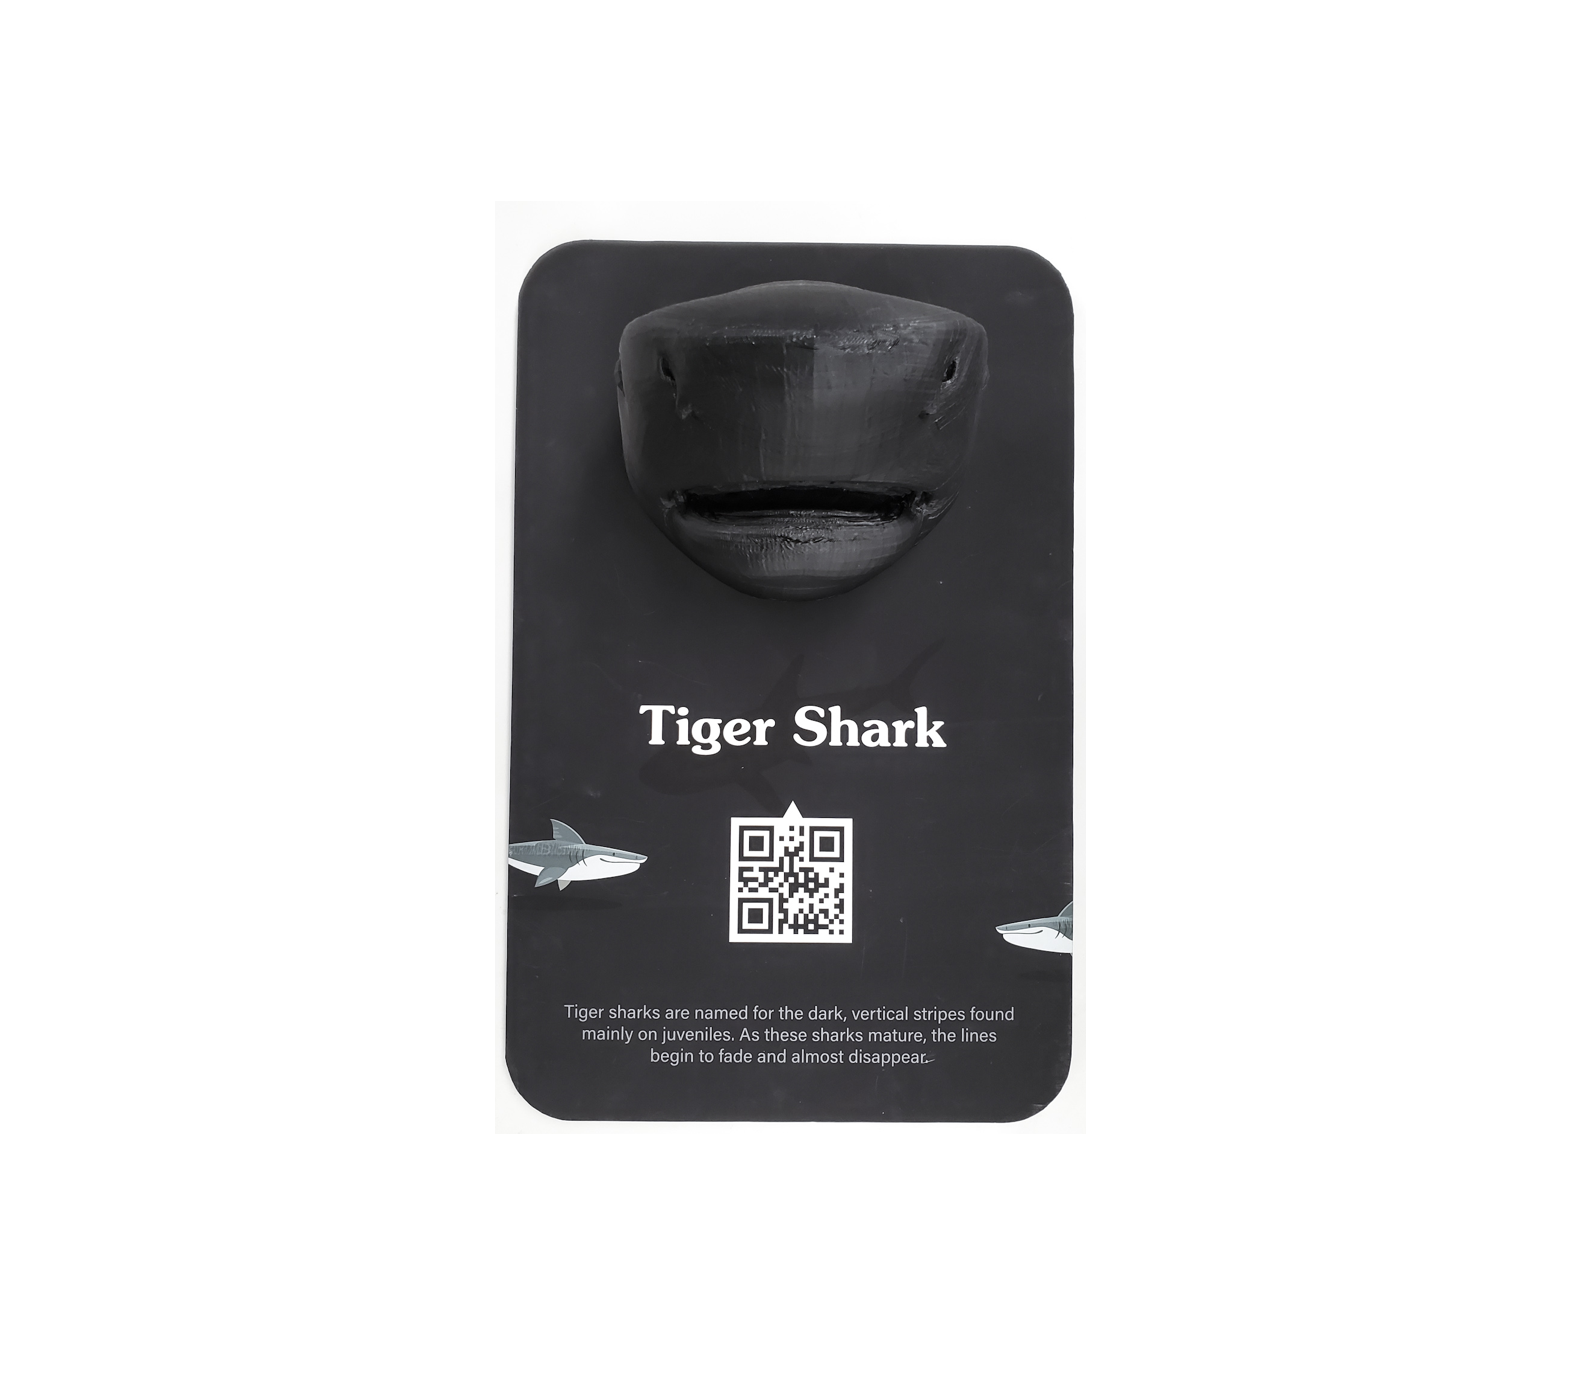
FIRST PART:
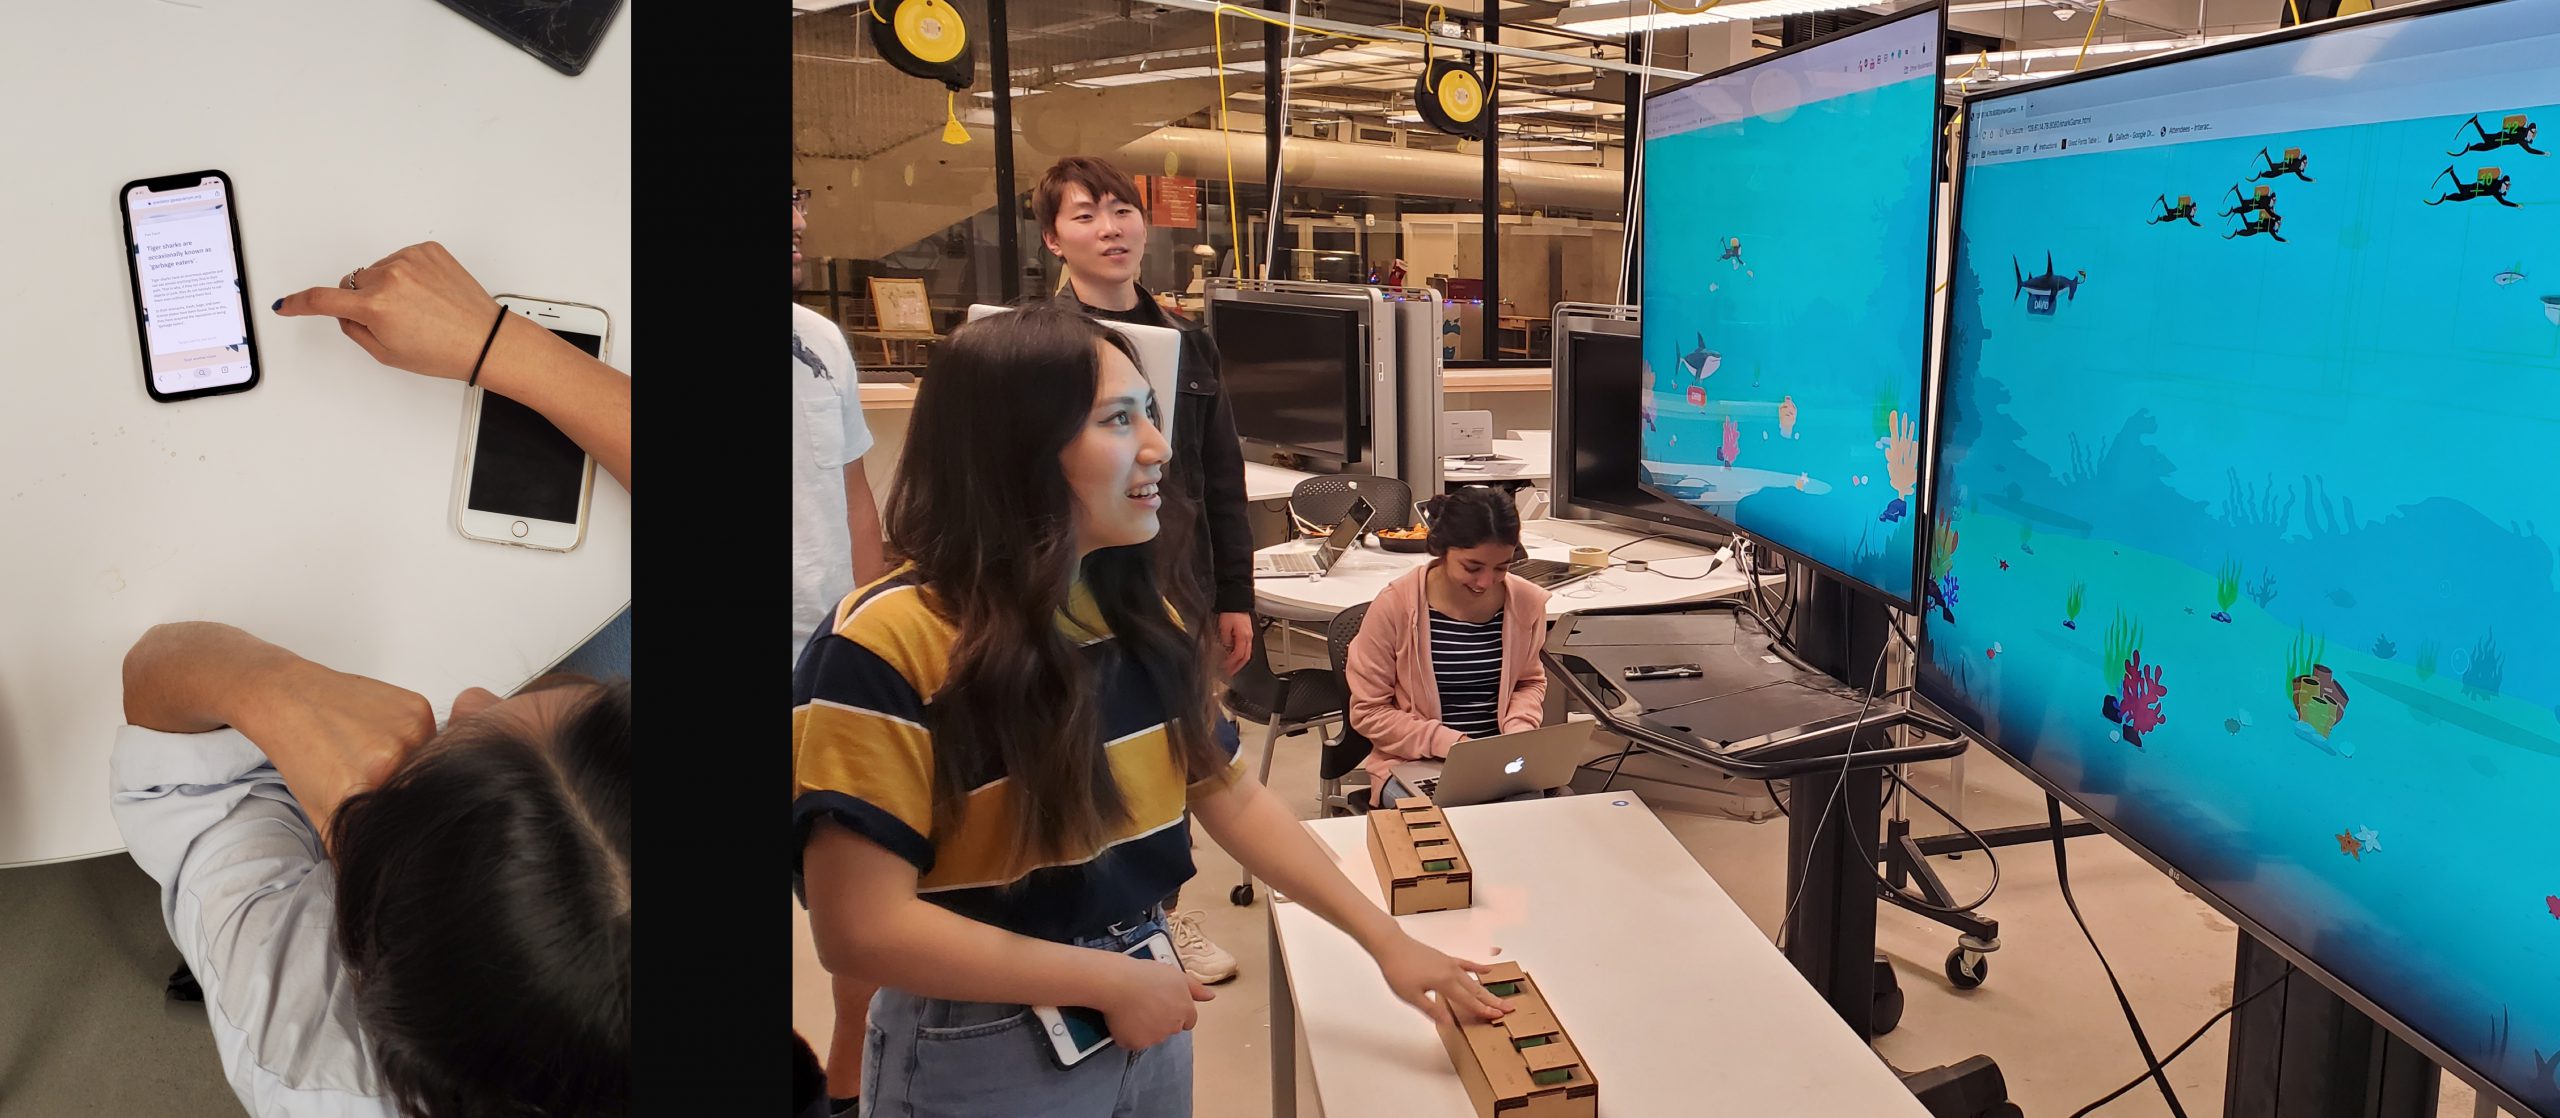
A 3D poster with a scannable QR code. This link takes you to a web application when accessed through the phone.
NOTABLE POSITIVES
- The lifelike shark draws the attention of kids and adults alike.
- With the increasing proliferation of QR technology, this process is seamless.
- It allows for an added layer of interactivity with the exhibit for visually-impaired individuals.
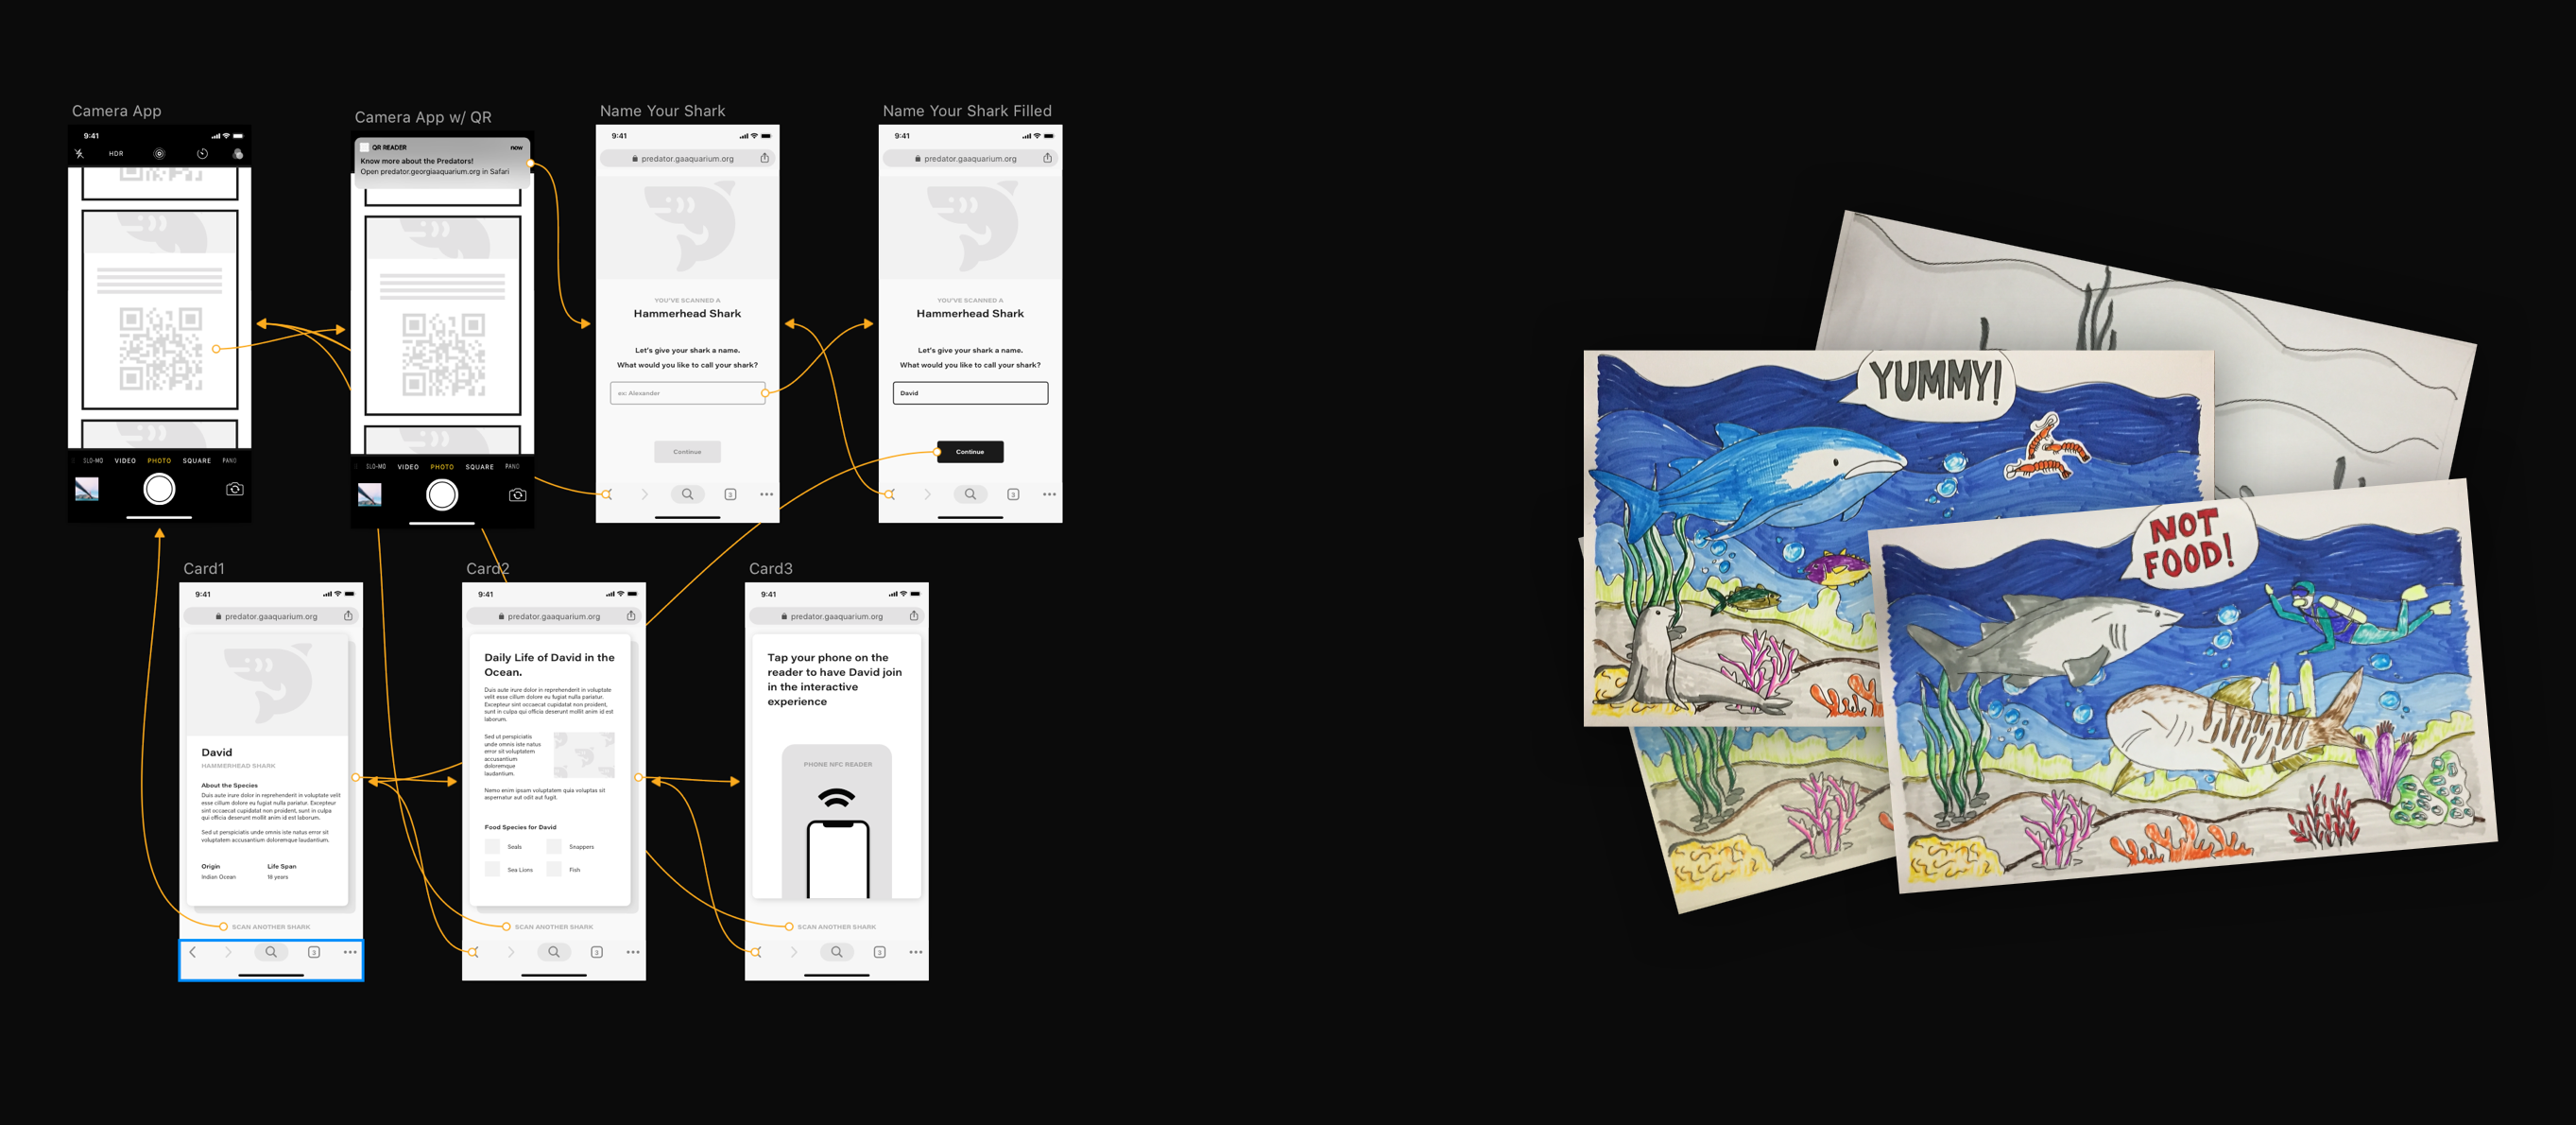
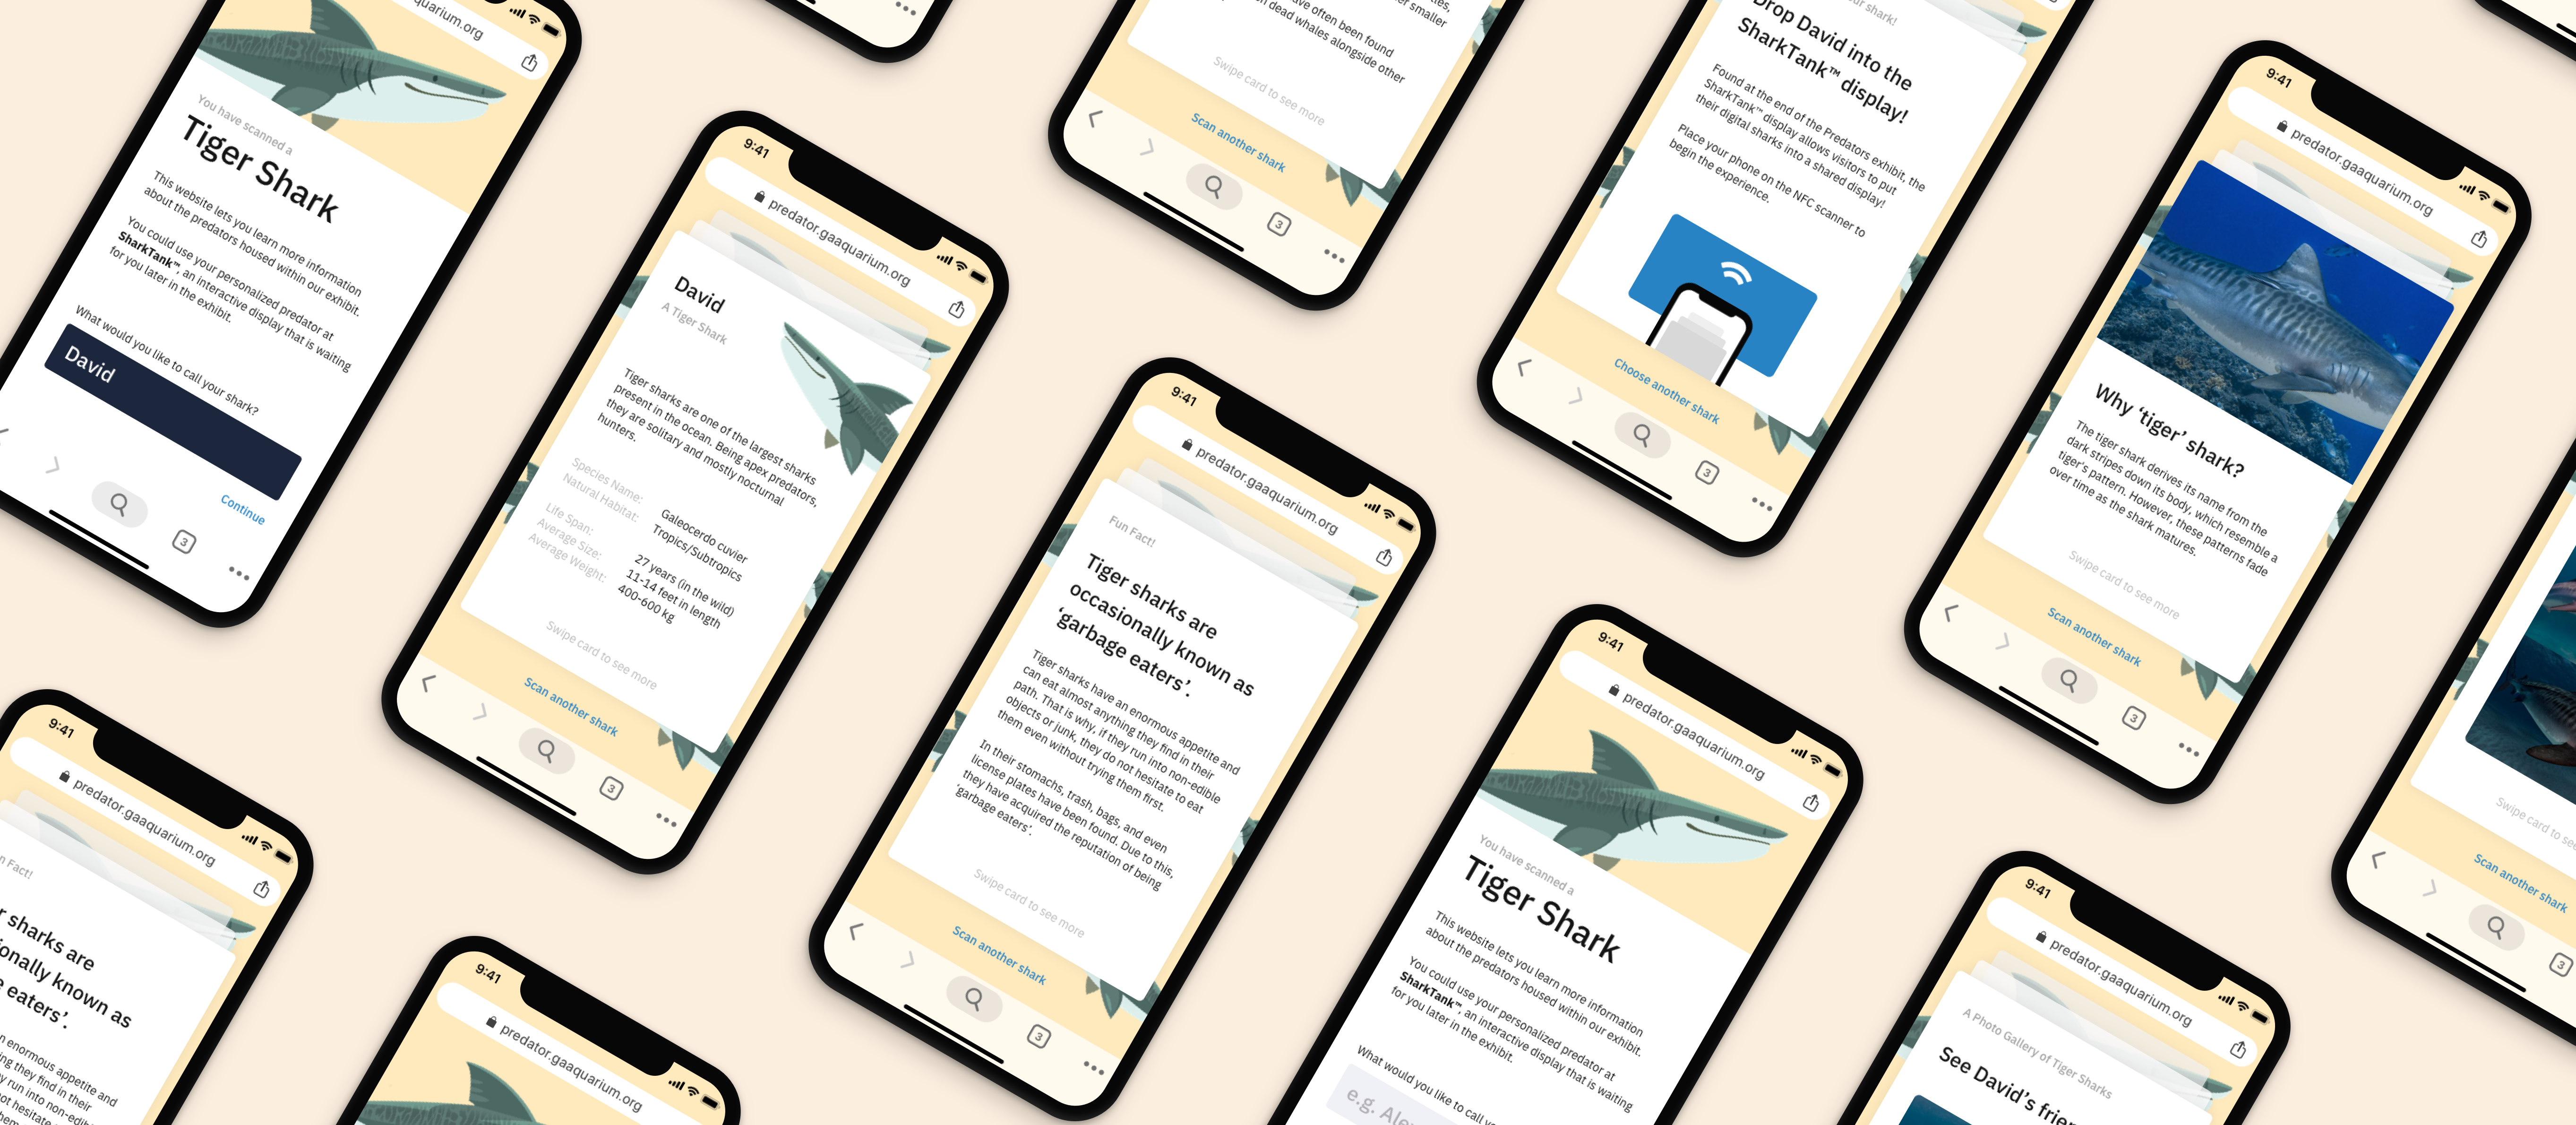
SECOND PART:
A website containing bite-sized information given by swiping through cards. The scanned species of shark shows up as ‘your’ shark on the website. Users can name their sharks.
NOTABLE POSITIVES
- Anthropomorphizes sharks by naming them and learning about them.
- Meant to be consumed by parents and adults, but also shared with children.
- Information is concise and the interaction is designed to not hinder the viewing experience.
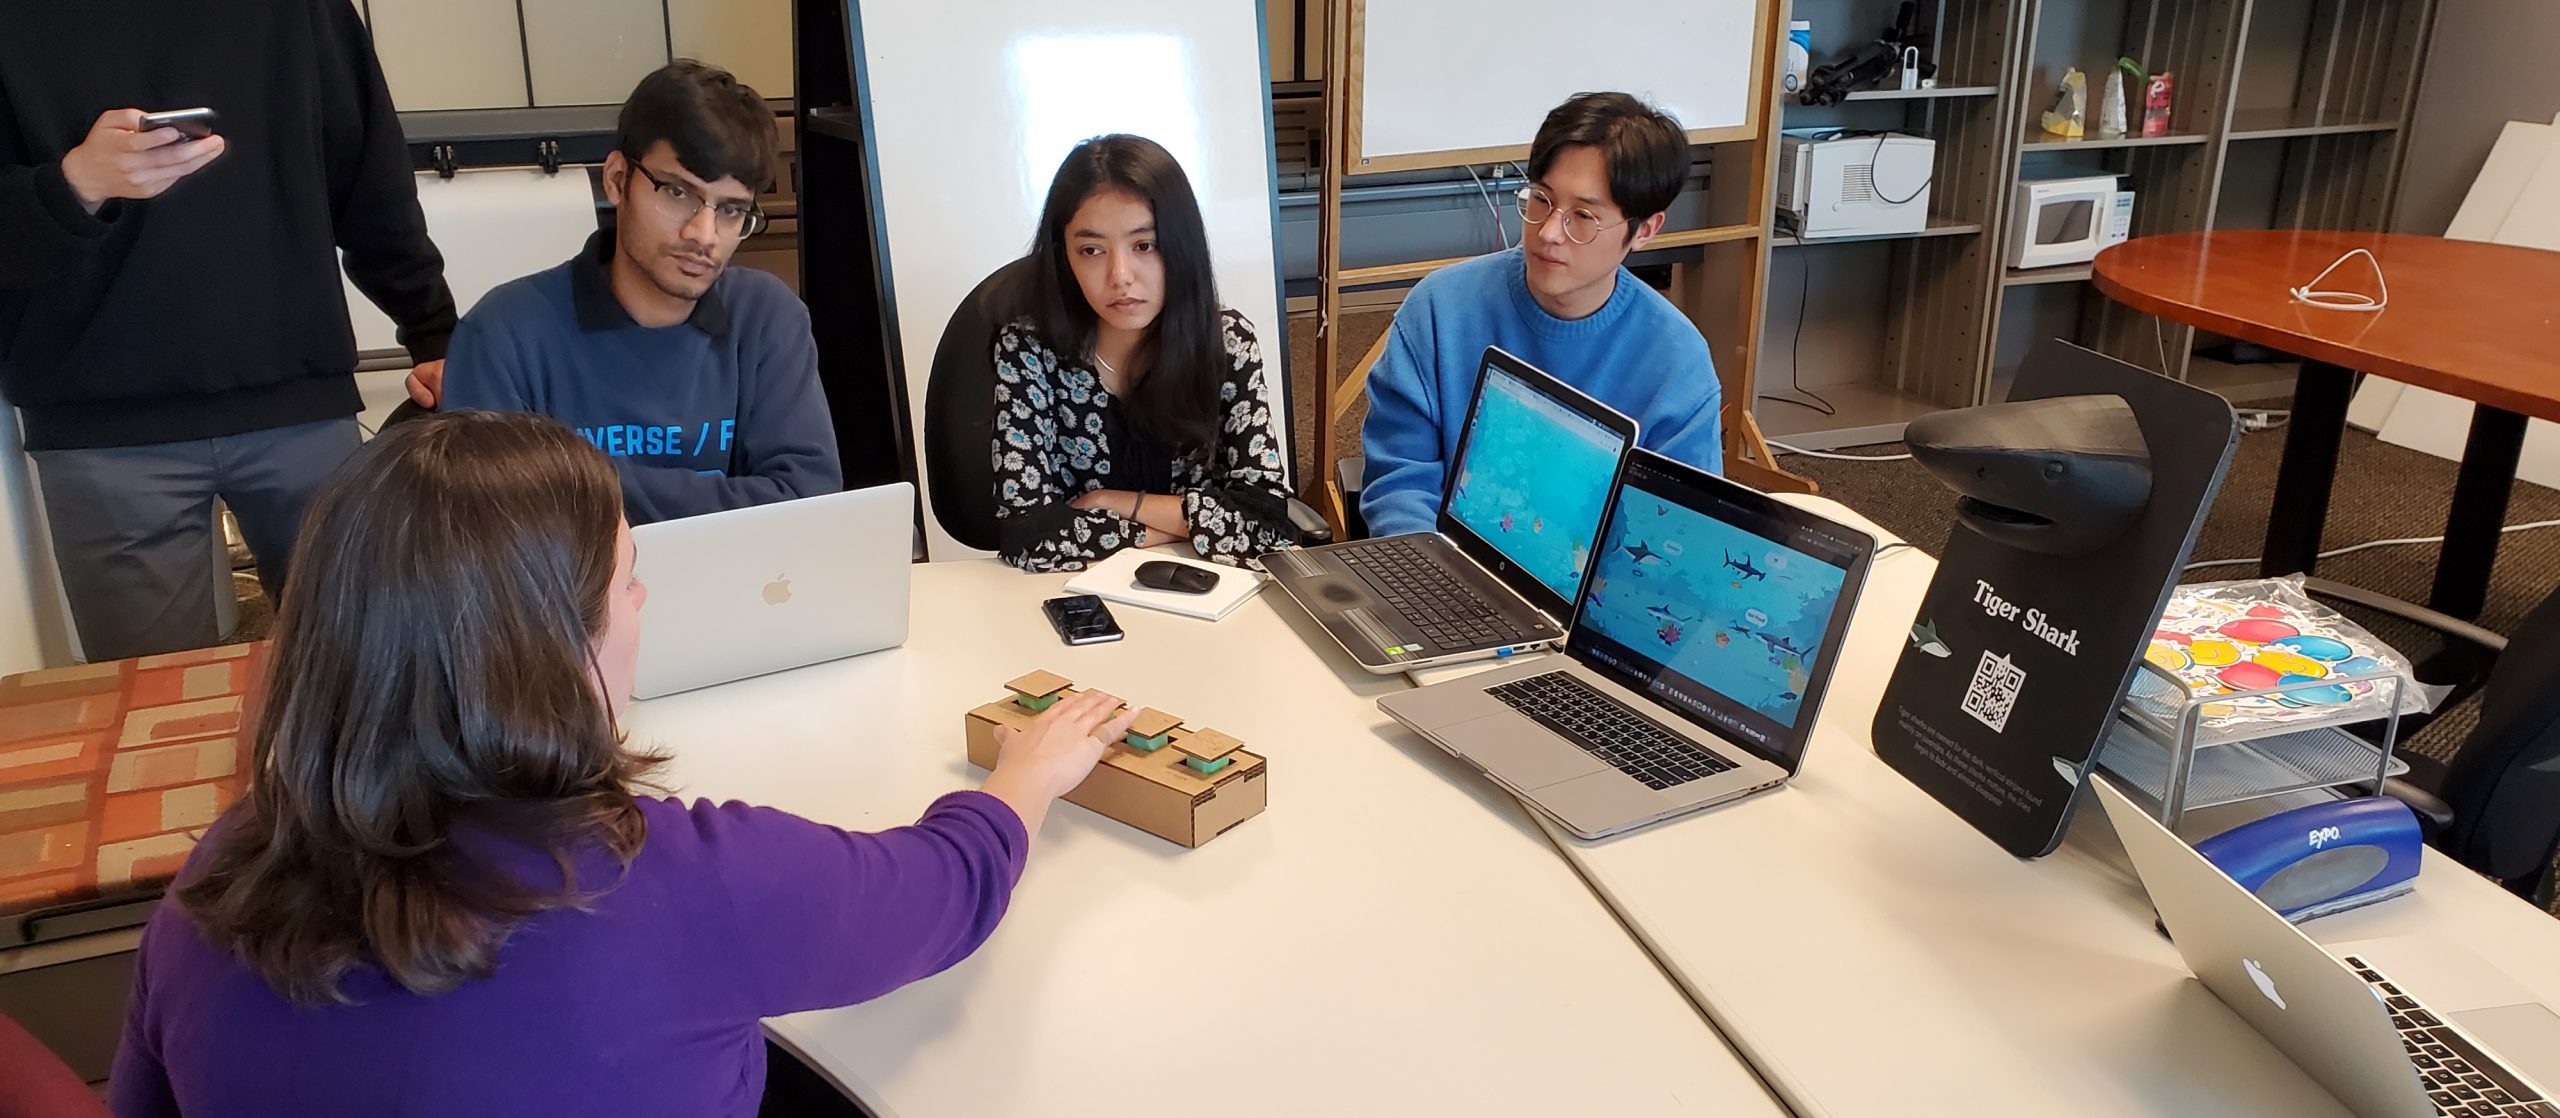
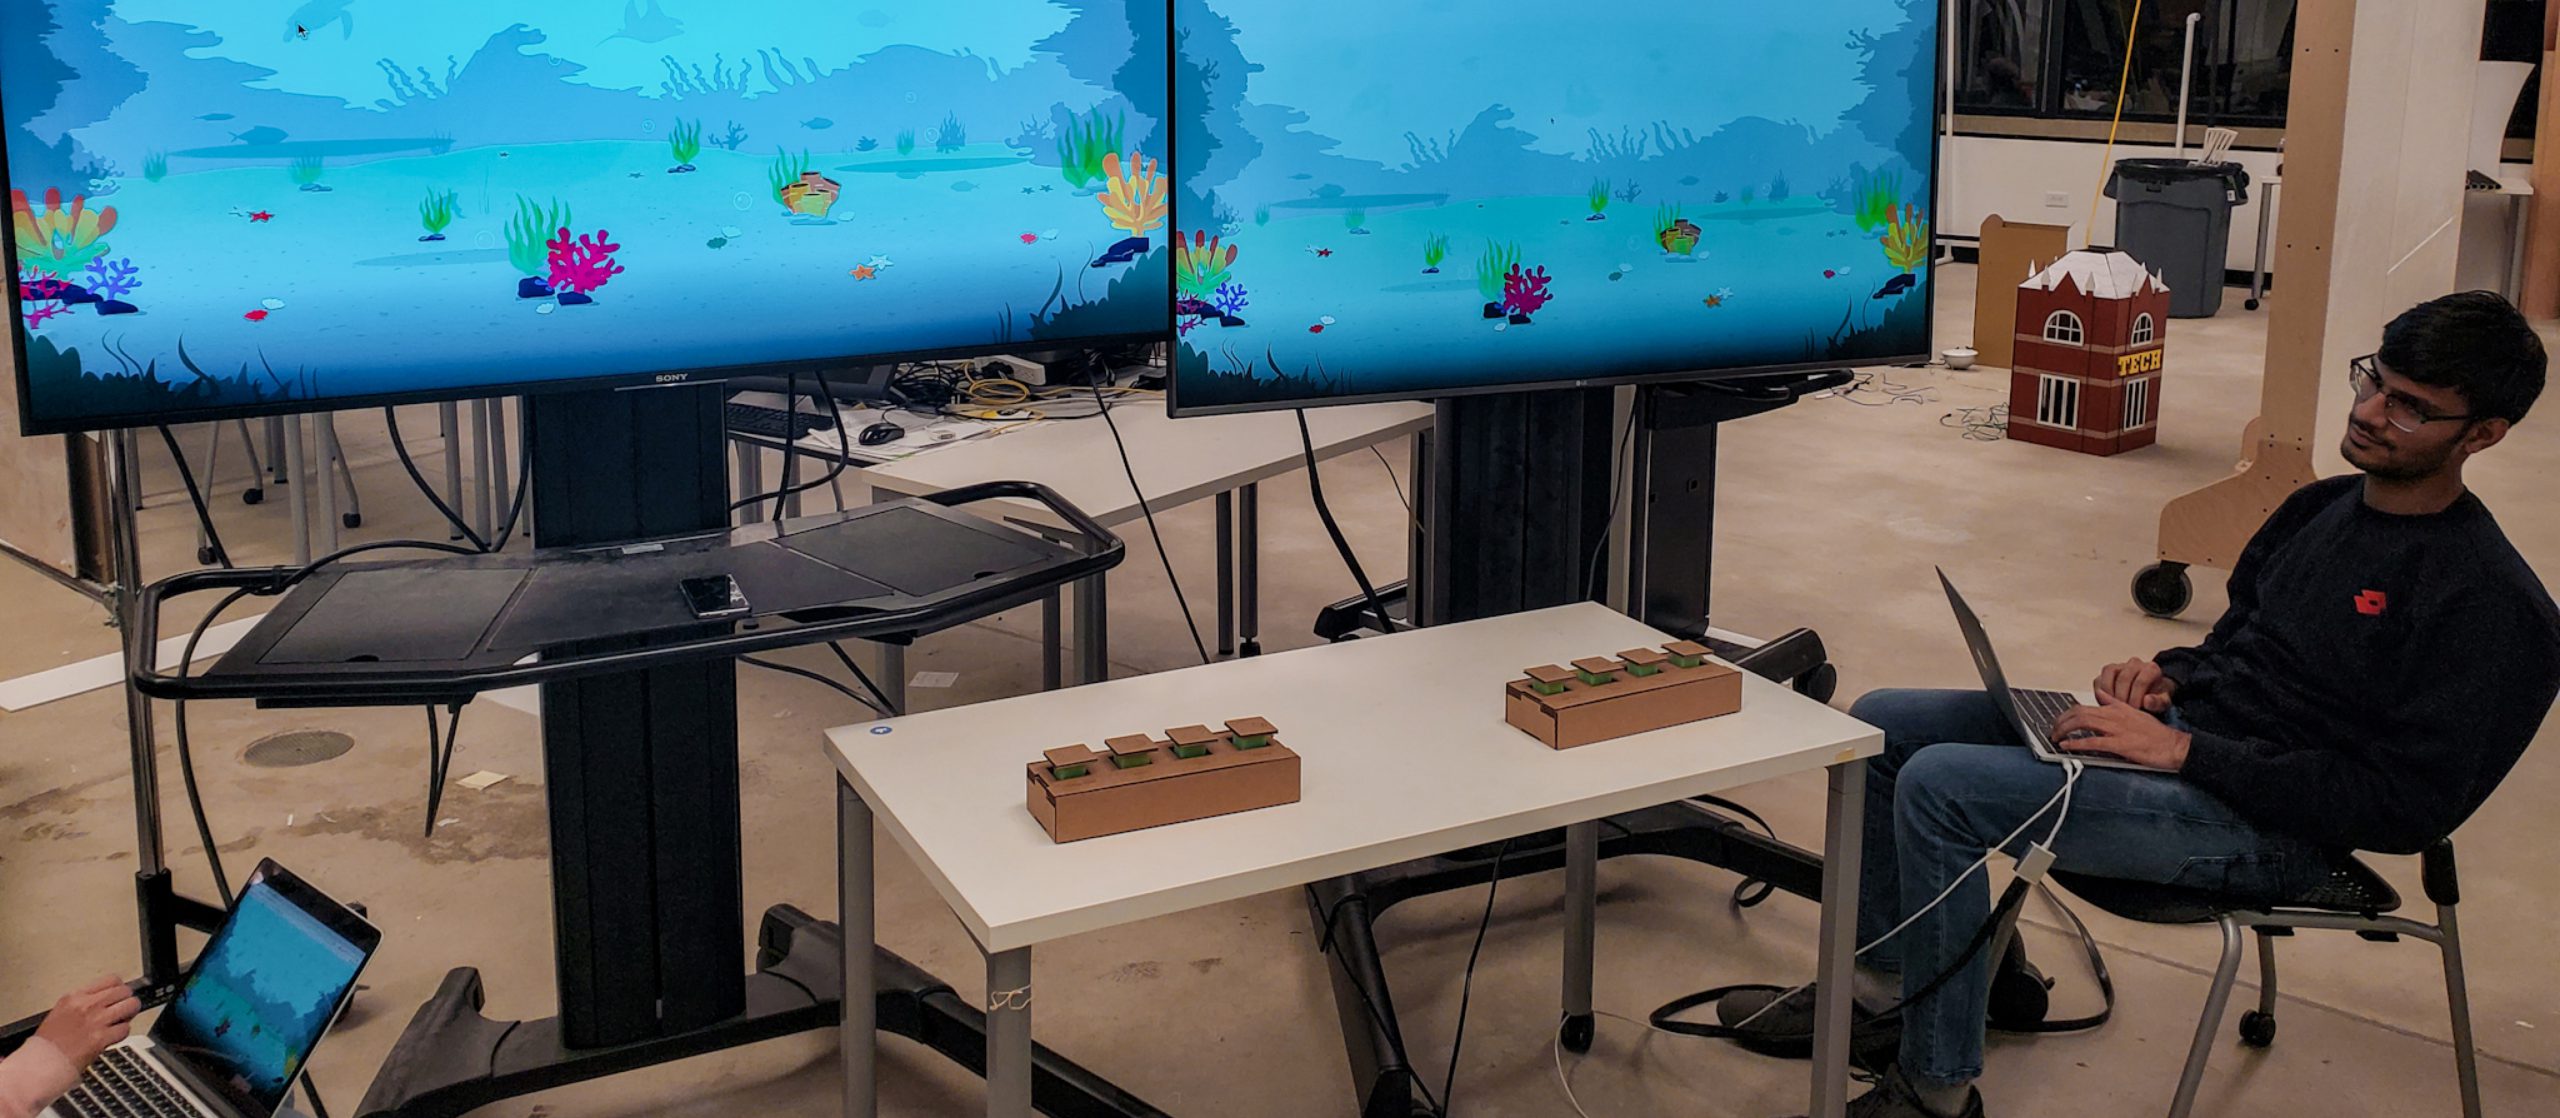
THIRD PART:
Users can drop their sharks into an interactive display later in the exhibit. Here, there is an informative game designed to focus on delivering the message to kids.
Accompanied by a button panel, users can choose which food item they could feed their sharks. Among a mix of marine species, there are humans too. Depending on what food a particular shark species eat, the virtual sharks respond accordingly.
NOTABLE POSITIVES
NOTABLE POSITIVES
- Informs visitors about the messaging that sharks DO NOT consider humans food.
- Visitors get to feed 'their' shark that they named and learned about on the website.
- This part of the experience is something that groups, families, and children can engage in together.


VALIDATION AND
Design Evaluation
Design Evaluation
To evaluate our design, we set up our prototype to resemble a display at the aquarium. We wanted to understand the dynamics involved when multiple people engage with the interactive screen. To replicate having actual buttons next to the display, we created cardboard-based prototypes to mimic the action within a Wizard-of-Oz evaluation setup.
Continuing the trend of improving mundane routines, during my last day at the office, I replaced the regular tea biscuits with Oreos! Hearing back pleasantries from the PMs and the Community Managers was delightful.
EXPERT EVALUATION:
PARTICIPANTS: 5
EXPERT EVALUATION:
PARTICIPANTS: 5
These experts included exhibit design managers and other personnel at the Georgia Aquarium. Professors with expertise in exhibit design and usability were also involved.
METHOD: COGNITIVE WALKTHROUGH
These experts were asked to perform certain tasks that a visitor at the Aquarium might do with our design. It was a think-aloud and was followed up with a set of questions.
USER-BASED EVALUATION:
PARTICIPANTS: 6
The participants included a group of friends and one family (a parent and a child). It was crucial to have people go through our prototype as groups. Among them, they had varied prior experiences with aquariums.
METHOD: FOCUS GROUPS
Participants were made to interact with the prototype and perform actions similar to a group visiting the aquarium. The session moderator frequently investigated for insights and led discussions.


To know about how this project taught me the value of design research, reach out to me at kundu@gatech.edu.
To know about how this project taught me the value of design research, reach out to me at kundu@gatech.edu.
CONNECT WITH ME ON [LINKEDIN] [INSTAGRAM]
CONNECT WITH
ME ON
[LINKEDIN]
[INSTAGRAM]
[0] ∑ASTER ∑GGS ON THIS PAGE
[0]
∑ASTER ∑GGS
ON THIS PAGE